How Fiscal Largesse Boosts Demand For Equities
NBR Articles, published 16 December 2020
This article, by Te Ahumairangi Chief Investment Officer Nicholas Bagnall, originally appeared in the NBR on 16 December 2020.
Governments have a privileged position of being able to spend money that they didn’t have in the first place. If a government spends money to build infrastructure, procure essential services, or support the needy, the people and firms whose bank accounts are bolstered by an inflow of money from the government will perceive that they’re wealthier as a result of their higher monetary balances.
Arguably, the “true wealth” of a country consists of its physical and intellectual assets, regardless of how those assets may be repackaged in the form of shares and other securities. Hence, a country does not truly become any wealthier simply because the government prints more bank notes or writes more IOUs. However, in the short term at least, people feel wealthier when the government pays them for something, regardless of whether they end up holding that payment in the form of cash or a highly liquid government security.
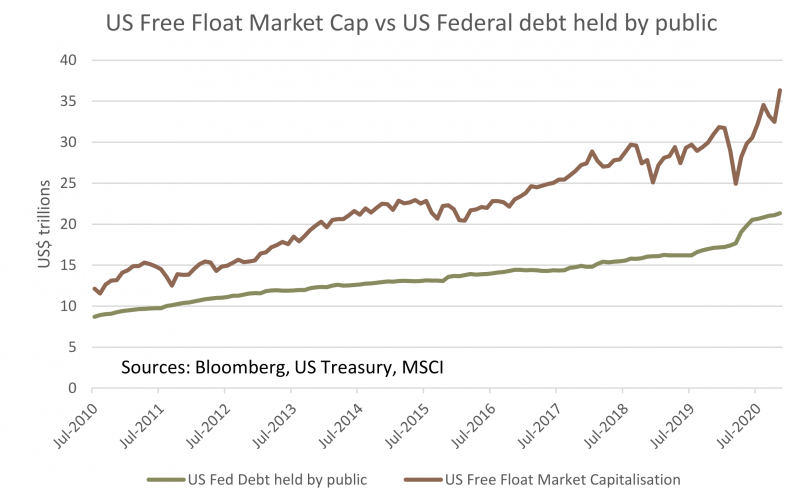
Over the past several years, and particularly during 2020, governments around the world have been spending a lot more money than they’ve collected in the form of taxes. As a result, the private sector’s aggregate holdings of government bonds and other monetary claims on government has risen rapidly, much faster than growth in economic activity. The graph below shows that US Federal Debt held by the private sector has risen by 130% in the last 10 years.
A puzzle for some economists is why people are in aggregate accumulating all this liquid wealth but not spending it on consumption. Conventional economic theory would argue that your typical individual or firm has a meaningful propensity to spend more when they’ve got more money or other liquid wealth lying around, particularly if they haven’t had to borrow to accumulate those funds. Indeed, this “propensity to consume” can be seen with your typical wage or salary earner – if you slip an extra $5,000 into the typical wage earner’s bank account, the odds may be pretty good that over the next year they’ll take an extra holiday or make an extra purchase that they wouldn’t have made if they hadn’t received the extra money.
But, like most rules in economics, it’s not quite that simple, because different people will respond quite differently to the stimulus of getting a bit of extra money, depending on their particular circumstances.
People and firms who often struggle to make ends meet will have a high “marginal propensity to consume” out of monetary balances, often using any extra funds they receive to fund expenditures that they’ve put off in the past. People and firms in this sort of situation may represent a large proportion of the population, but only hold a small proportion of monetary wealth.
At the other end of the spectrum, most of the monetary wealth of a country is held by people or organisations that are firmly in the “investing class” – those who hold investments equivalent to several years of annual expenditure. How will a member of the investing class respond if you put another $5000 in their bank account? Many investors will have a very low propensity to consume out of additional monetary wealth: after all, if they were already well-heeled enough to become significant investors, another $5000 would likely be just a “drop in the ocean” that makes little difference to their spending plans.
But the extra money still makes a difference to how they invest. Whether explicitly articulated or not, most investors have some sort of “neutral” asset allocation that they will tend to rebalance their portfolio towards. For many investors this default asset allocation costs of something like 60% in equities and 40% in fixed interest (bonds, cash deposits, and the like). So, if the net effect of a government’s fiscal deficit is that investors end up with (say) another trillion dollars’ worth of cash or fixed interest assets, then they’re going to respond to that by trying to buy more equities.
On the face of it, this example might seem to “only” create demand for $600 billion of equities: investors collectively receive $1 trillion of cash and government securities, so in order to maintain their target 60:40 weight they go out and buy $600 billion of equities, whilst reducing their holdings of cash and government securities to $400 million. But the government debt securities don’t disappear when one investor sells them to buy equities, and nor for that matter do many new shares sprout into existence in immediate response to investor demand. Rather, for each investor who sells some government securities to buy some equities, there must be another investor who has sold some equities and invested the proceeds in government debt securities. The net result is a bidding war, whereby a market full of investors who have collectively ended up with more cash or government debt securities as a result of fiscal largesse all try to rebalance their portfolios by buying more equities, but with few new equity securities being issued, they end up just bidding up the level of sharemarket until they get their target mix of bonds and equities almost purely as a result of a shift in market prices.
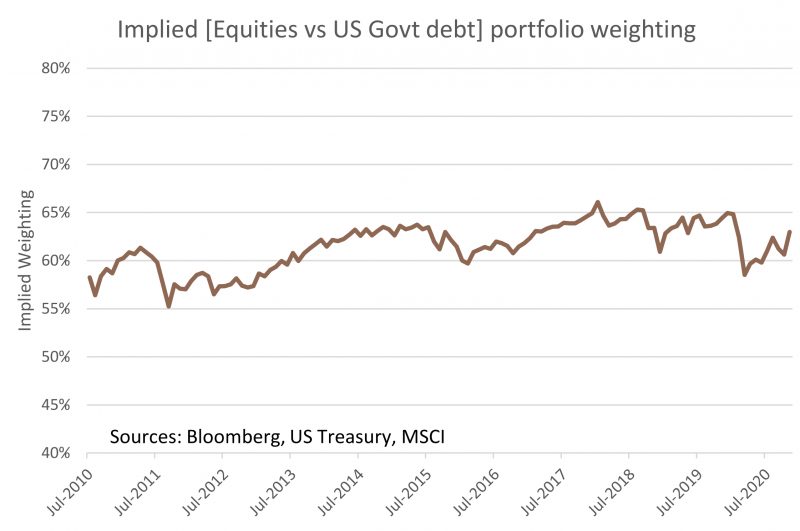
Although it doesn’t count as definitive evidence, the preceding graph seems roughly consistent with this view that investors are essentially behaving like automatons, buying more equities for the simple reason that easy fiscal policy is loading them up with more government-issued fixed interest securities. We can see this more starkly if we look (in the graph below) at the portfolio weightings that would be implied if we assumed that the same pool of investors held all the US equities and all the US Federal debt. Of course, it’s not nearly as simple as this, due to factors such as cross-border investment, privately issued fixed interest securities, and other asset classes. But putting these complications aside for a minute, we can see from the graph that despite the massive increase in US Federal indebtedness and the gyrations of the US sharemarket over the past 4 years, the implied portfolio weighting between bonds and equities has remained in a tight range around the 60:40 typical equity : bond allocation.
Intelligent investors won’t always behave in such robotic fashion. After all, no-one would want to hold equities if they provided little prospect of performing better than bonds, or to hold much fixed interest exposure if the prospective returns from equities were vastly superior. However, it is not an easy environment to be an investor, with low interest rates providing a good reason to be wary of fixed interest investments whilst record equity valuation multiples provide a reason to be wary of equities. Faced with the choice between the Scylla of zero-return bonds and the Charybdis of equity market downside, many investors seem to be figuring that the conventional 60:40 equity : bond mix remains an appropriate “middle of the strait” course between these two hazards.
Disclaimer: This article is for informational purposes only and is not, nor should be construed as, investment advice for any person. The writer is a director and shareholder of Te Ahumairangi Investment Management Limited. Te Ahumairangi manages client portfolios that are focussed on global equity investments.