If The Market Falls, What Will Fall Hardest?
NBR Articles, published 5 October 2021
This article, by Te Ahumairangi Chief Investment Officer Nicholas Bagnall, originally appeared in the NBR on 5 October 2021.
Global equity markets are trading at historically elevated levels, and inflation rates have risen significantly. The historical record would suggest that these facts mean there is a greater than normal risk that the equity market may take a big tumble in the next few years.
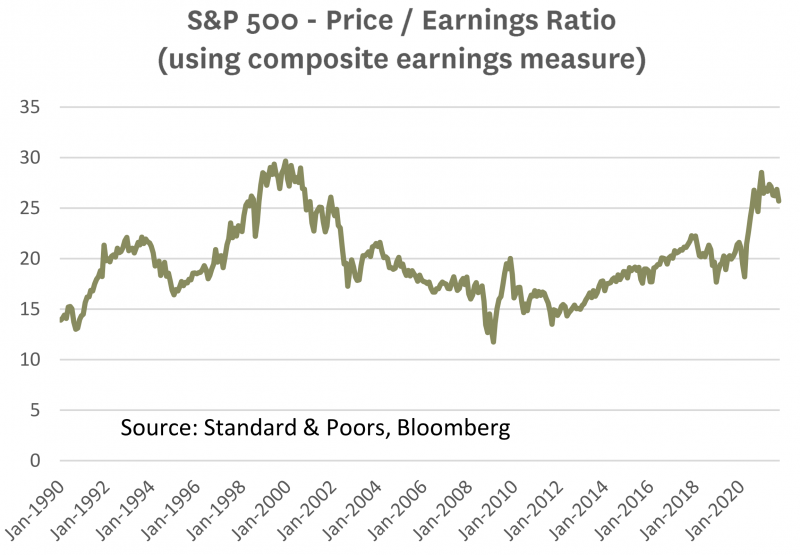
Consider the graph below, showing the Price-to-Earnings (P/E) ratio for the S&P index. To reduce the risk of paying too much attention to any single measure of earnings, I have calculated the P/E ratio using a blend of both historical and forward looking earnings measures, some of which have been normalised for unusual items, and others which have not. On this measure, the US share market is trading on its highest multiple of earnings since the "TMT" (tech, media, telecoms) boom that gained momentum in the late 1990s and ended abruptly (with the "tech wreck") in the year 2000.
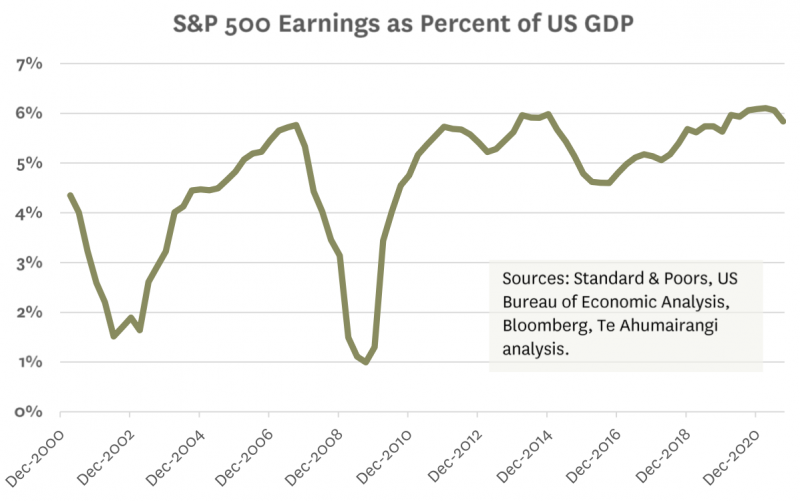
A high aggregate earnings multiple would be justified if there seemed to be a lot of potential for corporate earnings to grow at a faster rate than the broader economy. However, the graph below shows that US corporate earnings are already very high in comparison to GDP, which suggests that there is limited room for further growth.
But what about low interest rates? Interest rates are much lower than they were in the year 2000. Low interest rates (and the fact that world is awash with liquidity as a result of the fiscal and monetary response to the covid-19 pandemic) are the most obvious saviour that could prevent the tech boom of the last few years ending in the same unfortunate manner as the tech boom of the late 1990s.
If interest rates stay at current levels, it is certainly feasible that share market valuations could be sustained at current levels.
But low interest rates typically end when central banks feel the need to tighten monetary policy, and central banks around the world are charged with the objective of keeping inflation low. Unfortunately, inflation can no longer be described as "low" in the United States or many other countries. As the graph below shows, US Producer Price inflation is now at its highest level in 40 years, and US consumer price inflation is at its highest level in almost 30 years apart from a very brief spike in 2008.
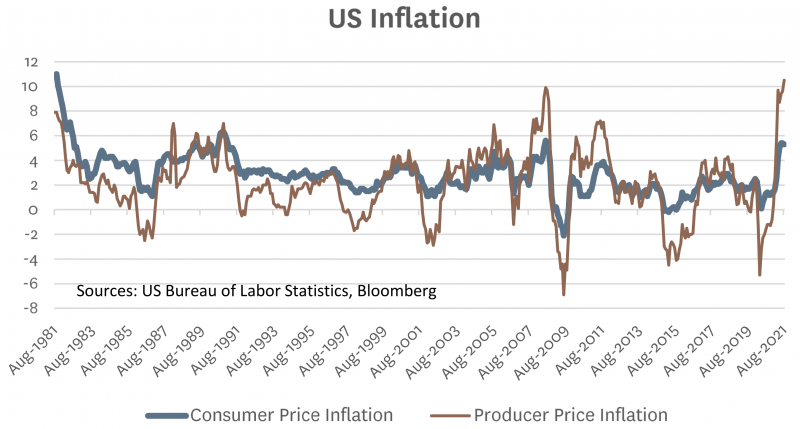
If US inflation stays at these elevated levels, it is difficult to see how the Fed can avoid tightening monetary policy. The start of a monetary tightening cycle has often been associated with a tumble in equity markets.
How can investors protect themselves from the risk of a sharemarket decline?
If we knew as a certainty that share markets were due to take a tumble, the obvious response would be to sell all equity holdings, and look to buy back into equities once the market had tumbled. However, the possibility of a share market tumble is just a risk, not a certainty. Given the relatively unattractive returns from fixed interest markets, investors might therefore look for equities that are likely to fall by less than the average stock in the event that the share market takes a tumble.
Such an approach is conceptually sound. When global equity markets fall, different stocks will fall by different amounts, and there are some patterns which can help predict which stocks will fall most in the event of a sustained share market decline.
It is easy to appreciate why some stocks will be hit harder than others when the share market declines. Share market declines are often associated with economic recessions and weaker markets for real estate and other “real assets”. In an environment of weak economic demand, lower asset values, and lower equity valuations, companies tend to cut back on capital expenditures and discretionary forms of operating expenditure (such as brand advertising). Likewise, consumers cut back on discretionary spending like travel and home renovations. On the other hand, other forms of spending are often hardly affected by a recession – people still buy their groceries, pay their power bills, and catch the bus to work.
As a result, companies that sell things like capital equipment or advertising will often be badly hit by a share market downturn (and any associated recession), and their share prices may suffer accordingly. By contrast, companies selling consumer staples or operating regulated utilities may not notice any impact on their profitability, and their share prices may therefore be barely affected by a big plunge in the broader share market.
Financial Leverage
Financial leverage will also affect how different share prices respond to a share market decline. Consider a company that has borrowed $4 billion against a business that the share market "believes" to be worth $9 billion. We should expect the shares in this company to be valued at $5 billion (= $9 billion minus $4 billion). If the share market changed its mind and decided that this business was now worth $8 billion, we would expect the valuation of this company to fall to $4 billion. Hence, the company's borrowings would have meant that an -11% decline in the value of its business causes a -20% in the value of its shares. But if this same company had not had any debt, the total value of its shares would have only fallen by -11% from $9 billion to $8 billion.
Sensitivity to hopes and fears and share market conceits
A less tangible determinant of how vulnerable a stock will be to a decline in the share market is how sensitive the value of the company might be to investors' hopes and fears.
For some companies with a solid history of producing steady profits, it could be difficult to crunch the numbers and come up with a valuation that is massively higher or massively lower than the current share price. Hence, even if investors start taking a "glass half empty" mindset to everything they look at, the share prices of such companies may not fall by much. For example, Verizon, America's largest telecommunications company, is valued by the market of just 10.3 times estimated earnings, and it pays out half of earnings as dividends each year. Sell side analysts are lukewarm on its stock, but this does not seem to be because they see any significant downside risks, but just that they don't believe that Verizon is going to achieve much more than the 1 to 2% growth it's been averaging in recent years. As there is very little excitement priced into this stock, it seems to be the sort of stock that might hold up relatively well if the share market took a big plunge.
Conversely, companies that have really captured investors' imaginations about what they could possibly achieve have a lot further to fall if those investors start demanding a higher level of certainty about future prospects. Tesla, which is valued at 18.5 times annual sales and 147 times estimated current year earnings, could be a good example of this. Although Tesla has achieved strong growth over the past year, investors are paying a price that implies that it will continue to achieve very strong growth rates for a decade or more. If investors' moods shift from "glass half full" to "glass half empty", Tesla's share price may fall by more than many other stocks.
Most sustained share market sell-offs seem to hit the group of stocks that had been most in vogue in the bull market that preceded the correction. The Global Financial Crisis of 2007 to 2009 was particularly hard on the share prices financial companies and a handful companies that had embraced a model of continually borrowing increasing amounts against the cashflows generated by their existing assets in order to finance the acquisition of further assets. The tech wreck of 2000-2003 was particularly hard on the high-growth tech, media, and telecommunications companies that had been in vogue in the late 1990s. And New Zealand's own version of 1987 share market crash was particularly hard on the share prices of the "investment companies" and property developers that had been glorified by New Zealand share market investors during the mid 1980s.
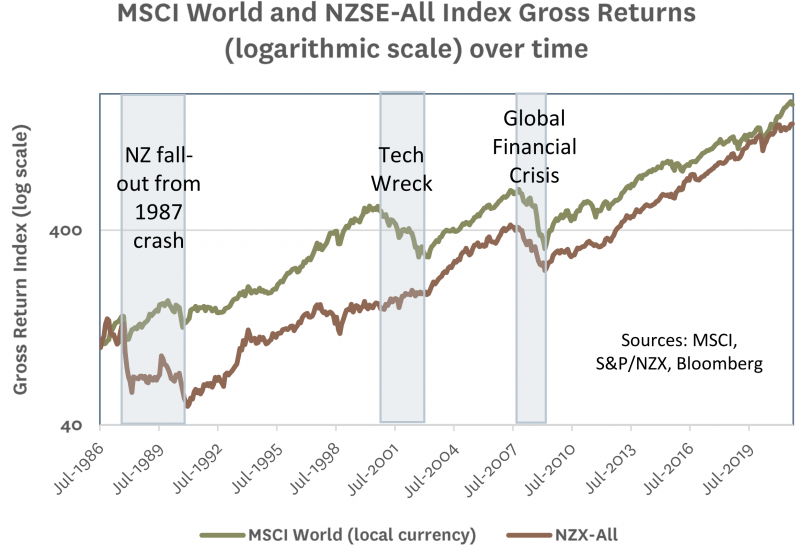
In each of these cases, it could be argued that a common investor conceit was inflating the value of the group of stocks that subsequently fell the hardest:
- Prior to 1987, NZ investors thought that the likes of Ron Brierley and Allan Hawkins were such geniuses that their share prices ought to be valued at significant premiums to the underlying asset value, and therefore figured that the value of these companies increased by $100 million each time they held a cash issue and raised $50 million.
- During the TMT boom of the late 1990s, investors seemed to think that virtually every tech, media, and telecommunications company could indefinitely grow its revenues by a lot faster than the broader economy. They also seemed to assume that every unprofitable early stage tech company would grow until it achieved economies of scale, and the vast sums of money being invested in these sectors were bound to ultimately achieve strong returns on invested capital. Some would argue that investors are repeating these mistakes today.
- Prior to the GFC, investors believed in the sustainability of a financial model whereby borrowers (including listed companies) would take advantage of rising asset values to borrow more money to buy more assets, while their lenders enjoyed rapid loan growth and took comfort from the fact that rising asset values supposedly underpinned the credit quality of their loans.
In each of these cases, those stocks that were most dependent on this investor conceit fell the hardest when reality came knocking.
In addition to deflating hopes, share market meltdowns tend to bring about rising fears. Companies that have poor disclosure, intrinsically volatile earnings, or high levels of debt will generally be most vulnerable to a rising state of fear, because fear is most likely to take hold in cases where a worst case scenario seems most plausible. Perhaps related to this, stocks that had been sliding before a share market meltdown gathers full steam are often amongst the worst performers when the share market really plunges.
The concept of Beta
In finance theory, the concept of "beta" holds that each stock has an intrinsic tendency to move by a certain multiplier in relation to a change in the value of the share market. For example, a stock with a beta of 1.5 would be expected to rise by 7.5% in the event that the market rose by 5%, but to decline by -15% on the event that the share market fell by -10%. But another stock with a beta of just 0.5 would be expected to rise only 2.5% if the market rose by 5%, and to fall just -5% in the share market fell by 10%.
Related to this, one approach to estimating what downside different stocks would have in the event of a share market tumble is to statistically estimate the historical beta of each stock, and assume that this historical beta will apply in the future. By and large, this approach works pretty well. When share markets take a big tumble, many of the stocks that fall the hardest are the ones that were showing a high historical beta prior to the decline, and a lot of the stocks that are relatively unaffected by the decline are those that would have previously screened as having a low beta.
In the table below, I show estimated betas based on the historical pattern of returns from some of the world’s largest listed companies:
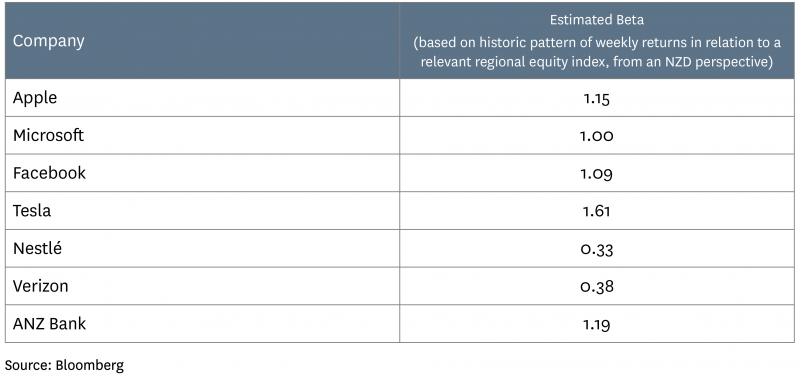
If the historic pattern holds, these betas would suggest that shares Nestlé and Verizon would be likely to be relatively defensive in the event of a share market decline, whereas shares in Tesla would be more likely to underperform if the share market declined sharply.
Historical Betas don't always predict the future well
There are always some exceptions. A case in point is Zoom Video Communications. In 2019, Zoom screened as being quite a high beta stock, which is not surprising given that it was only marginally profitable, and was valued on a high multiple of revenues. However, when Covid-19 struck, Zoom was perfectly positioned for the work-from-home transition, and its share price rose each time a country or major city went into lockdown (which generally had the opposite impact on the rest of the market).
This demonstrates that the defensiveness or vulnerability of any stock to a plunge in the share market will depend in large part on what is causing the plunge in the share market. Cloud computing companies will do well when a share market crash is caused by a pandemic keeping people at home, but may not do so well if it were caused by a solar storm wiping out the world’s electrical circuits!
Another example of a failure of historically derived estimates of risk was how real estate investment trusts (REITs) performed during the Global Financial Crisis (GFC). Prior to the GFC, REITs were perceived as very defensive, and accordingly their share prices had not tended to move significantly in response to movements in the broader share market, such that most of them screened as having relatively low betas. However, during the GFC there was sudden drying-up in the availability of debt finance for property investments, which resulted in a decline in real estate values and many REITs facing liquidity crises. US REITs fell more than -70% from peak to trough, belying their supposedly defensive characteristics.
Despite these occasional failings of historical betas as an indicator of future risk, we believe that it remains a useful indicator, particularly when supplemented by some logical thinking and qualitative assessment of risks.
What held up in the 2000 tech wreck?
Given that the current market environment feels more like the TMT boom of the late 1990s than the pre-GFC period of runaway lending, it is potentially instructive to consider how different groups of equities performed after the share market peaked in early 2000. For the graph below, I compare the performance of global equity indices over the 5 year period from 31 March 2000 to 31 March 2005:
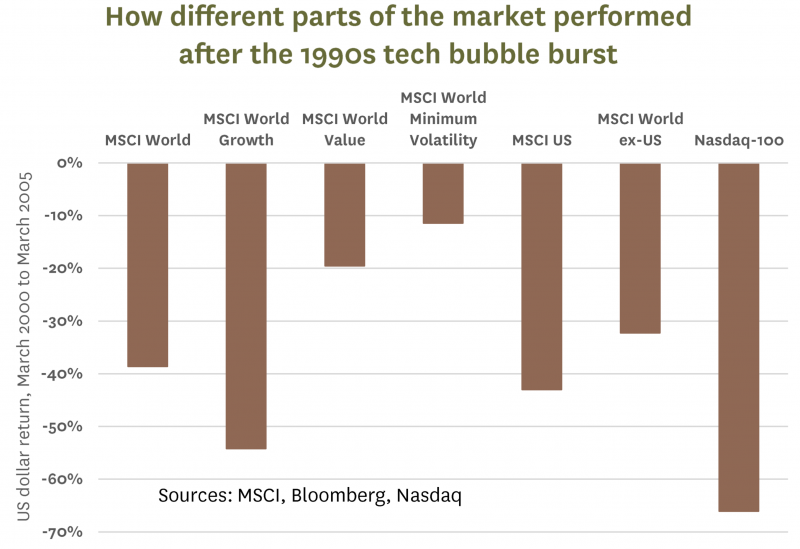
Clearly, most global equities suffered after the 1990s Tech-Media-Telecommunications bubble burst. However, as can be seen from the chart, some parts of the market were harder hit than others, and the parts that were hit the hardest were generally those that had rallied the hardest during the preceding boom.
As MSCI’s sector indices are not available back to March 2000, the best measure of the hot stocks during the TMT boom is probably the Nasdaq 100 index, which had more than quadrupled from late 1997 to early 2000. By 2002 had given back all of these gains, and as the graph above shows, this index was still well below its highs in 2005.
The poor performance of MSCI World Growth index indicates that other “growthy” stocks were also hit hard by the fallout from the tech wreck. Retail investors who put all their eggs in “growth focussed” investment baskets may want to ponder the -54% decline in the MSCI Growth index over this 5 year period.
While few areas of the share market escaped the carnage, the graph above does reveal two areas of relative defensiveness during the fallout from the TMT boom. Value stocks “only” declined by -19.5%, and the MSCI Minimum Volatility index declined by just -11.4%. The MSCI Minimum Volatility index is constructed according to rules & algorithms that means that it tends to load up with those stocks that screen as having low historical betas.
Disclaimer: This article is for informational purposes only and is not, nor should be construed as, investment advice for any person. The writer is a director and shareholder of Te Ahumairangi Investment Management Limited. Te Ahumairangi manages client portfolios that it aims to skew towards the defensive types of equities discussed in this article. These client portfolios hold shares in companies specifically mentioned in this article, including Verizon, Apple, Microsoft, Facebook, and Nestlé.
Companies that have really captured investors' imaginations about what they could possibly achieve have a lot further to fall if those investors start demanding a higher level of certainty about future prospects