The Half-Life Of Growth
NBR Articles, published 27 July 2021
This article, by Te Ahumairangi Chief Investment Officer Nicholas Bagnall, originally appeared in the NBR on 27 July 2021.
Growth (in revenues, profits, and cashflows) is a critically important determinant of the return you get from an equity investment, particularly for investments in companies that wouldn’t need to deploy much further capital to accommodate any growth.
Also, it is clear that a track record of growth can often be a strong indicator of future growth. The proportion of listed companies that have consistently achieved above-average growth for 10 or more years in a row is far higher than it would be if growth was simply an unpredictable "random walk".
Superior Growth Doesn't Last Forever
No company can perpetually grow faster than the broader economy. If it did, its revenues would have to ultimately exceed GDP, which is impossible, and in any case, no company has ever come close to achieving that. For the last 20 years, Walmart has been the largest listed company in the world by sales, and its revenues have been hovering between about 0.6% and 0.7% of global GDP. The graph below compares growth in the sales of four large companies – IBM, WalMart, Apple, and Amazon – with growth in global GDP. The logarithmic scale means that the slope of each line at each point in time reflects its percentage growth rate.
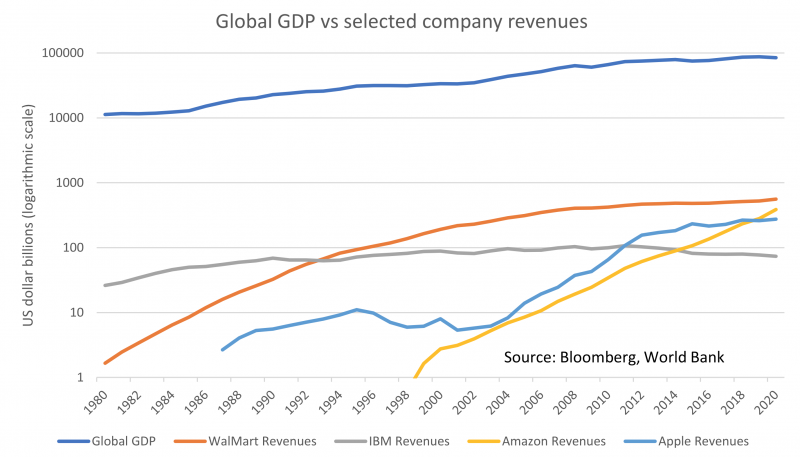
All of these four companies have been growing rapidly at some point in their history:
- For IBM, most of this rapid growth occurred before the start of the graph, but it was still growing faster than the broader economy in the early 1980s. Since the mid-1980s, IBM has significantly lagged the broader global economy – its revenues haven’t even kept up with inflation.
- Walmart’s rapid growth phase (which had commenced with the opening of the first Walmart store in 1962) continued until the early 2000s. Since then, Walmart has continued to grow, but its growth has only been roughly in line with global GDP growth.
- Apple’s most recent period of prolonged rapid growth started with the launch of the iPod in 2001 (followed by the iPhone in 2007). But since iPhones became ubiquitous in 2015, Apple’s revenues have only grown at about the same rate as global GDP.
- Amazon’s sales growth has not yet slowed, and at the current trajectory it looks set to overtake Walmart as the world's largest company by revenues in about 2 years. In fact, if you believed broker forecasts for Amazon's long-term growth rate, it's sales would seem to be on track to exceed global GDP in about 21 years' time (which is of course impossible).
All rapidly growing companies will eventually see their growth rate fade down to a point where they are growing no faster than the general economy, and most companies ultimately end up in a point of gradual stagnation, where they gradually lose share of wallet to newer up-and-coming companies.
While the companies shown in the graph all kept achieving superior growth rates until they were amongst the largest the world has even known (each achieving sales in excess of 0.3% of global GDP), most companies stop growing faster than the broader economy long before they get to this sort of scale. This can be because their addressable markets are much smaller than the markets addressed by the likes of Apple and Amazon, or because they are eclipsed by competitors whose offerings eat into their market share.
Growth fade creates a risk when you've paid a valuation premium for that growth
In summary, it is inevitable that any rapidly growing company will ultimately face a slowing in its growth rate. A key issue that investors in growth companies (such as Amazon) need to consider is the rate at which this growth will fade. Rapidly growing companies tend to be priced at a premium to other companies, so they will only provide superior returns if their growth rates fade gently enough to compensate for a lower yield and a gradual loss of this valuation premium.
Looking at the examples of IBM and Walmart in the graph above, IBM's growth rate faded fairly abruptly in the mid 1980s, and accordingly the subsequent returns to investors in IBM have been significantly worse than the market's. On the other hand, Walmart's growth fade has been more gradual, and the returns to investors in Walmart over the last 15 years have only slightly lagged the market (which arguably counts as a win for Walmart, given its more defensive risk characteristics).
Over the last two years, the premium that the share market has been paying for growth companies has been well above historical averages, which means that the risk associated with investing in a company with a rapidly fading growth rate is now greater than it was in the past. In past market environments (such as around 2006), the difference in valuation multiples been rapidly growing companies and their more pedestrian peers was so narrow that you only needed to believe that the growth would persist for another couple of years to justify investing in rapidly growing companies. By contrast, valuation spreads are now so wide that it some cases it could take decades of strong growth for some growth companies to grow earnings to the point where they match the valuation multiples of their more pedestrian peers.
For example, Tesla is valued at 17 times annual sales while other car companies with less developed electric vehicle offerings are valued at about half of annual sales. To justify this valuation differential, Tesla will need to keep taking market share off other car companies for more than just the next decade.
How can we distinguish growth fade from ongoing growth?
The investment risks created by fading growth make it important to identify characteristics that may help us to differentiate between companies that are likely to continue to grow for some time and companies that are likely to experience a more sudden growth-fade.
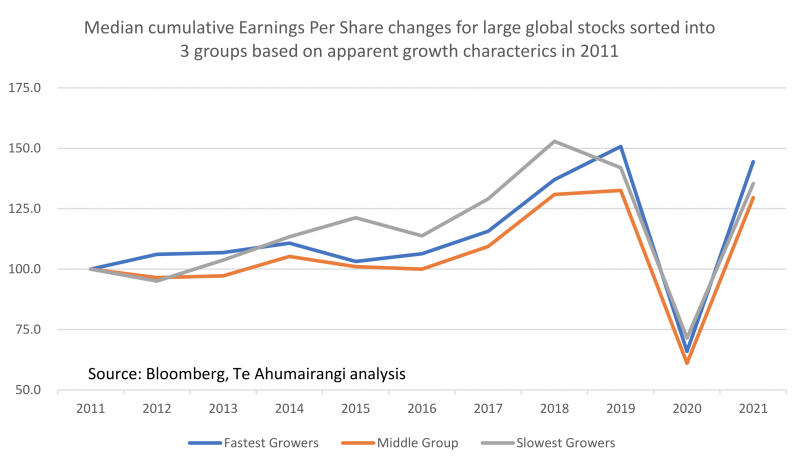
The mere fact of historical growth is not in itself a very reliable indicator of future growth. For example, I sorted the largest listed profitable developed market companies from 10 years ago into 3 groups based on a combination of things that we could have observed back then about their growth characteristics. This included these companies': historical rates of growth in sales; historical growth in earnings per share; historical growth in free cashflow; surveyed analyst expectations for each company's long term growth prospects; and the return on invested capital that each company was achieving. The various companies were ranked on each of these factors, and based on weighted average of these rankings, I divided the companies into 3 groups, and looked at median subsequent growth in EPS for each of these groups. As the graph below shows, these factors did not provide a lot of help when it came to predicting future growth. In fact, the median company in the group that had previous exhibited the slowest growth actually grew faster in the subsequent 5 years than the median company from the group of "fast growers".
Clearly we need to look at more than just historic growth when we're trying to identify continued future growth. Some characteristics that seem to help distinguish between future growers and future faders include the following:
- Big Structural Tailwinds. Companies that achieve ten or more years of continuous growth often benefit from a fundamental change in technology or in how people or businesses go about their lives. For example, many of the companies that have grown most strongly over the past decade are those that have provided internet-based solutions to things that we used to do without the help of the internet. Identifying the next big switch like this may help to identify the growth companies of the next decade.
- Distinguishing between cyclical growth and secular growth. Cyclical businesses will often rank up amongst the fastest growing companies when they are at the top of their own particular cycles. For example, when I sorted companies into groups of fast or slow growers for the graph above, BHP Billiton screened as being one of the seemingly fastest growers in 2011. It is important to recognise that past growth is likely to be a particularly poor indicator of future growth when a company's earnings are boosted by an industrial, economic, or commodity cycle.
- Growth in recurring revenues vs growth from sale of capital items. If you study the companies that have achieved the most consistent revenue and profit growth over the past decade, you will notice a predominance of companies that have subscription-based business models, or similar forms of recurring revenue. Subscription-based business models have the benefit of delivering increased revenues (and even faster growth in profits) for as long as the number of people or firms using the product continues to increase. By contrast, business models that rely on selling capital items will often see their sales stall well before the number of people using their product reaches its peak. This is because a large proportion of these companies' sales will come from first-time users, such that a mere deceleration in demand growth can lead to a drop in sales. For example, more people are now using personal computers now than at any time in the past, but the peak in global sales of personal computers was 10 years ago, in 2011. Another example is that the number of iPhones being actively used grew by 76% between 2015 and 2020, but Apple's revenues from the sale of iPhones was actually lower in 2020 than it had been in 2015. By contrast, companies like Microsoft, Adobe, Netflix, and Xero, which derive most of their revenues from subscription-based software and services, continue to enjoy steady growth in revenues as more people use their software or services.
- Starting from a small base. Superior growth is far more common for companies that are starting from a low base than it for companies that are already large. Of the 20 companies in the MSCI large cap index that managed to double their sales over both the 2010 to 2015 period and the 2015 to 2020 period, only two (Amazon and Alphabet) had more than $5 billion of sales back in 2010.
- A large untapped market. A company has a lot more growth potential when it has only taken a small share of a large potential market. For example, in 2010 only one sixth of advertising media spend was on-line, which meant that the potential for the online share of total advertising to expand over time was a massive opportunity for companies like Facebook and Google. But today, online advertising represents well over half of total advertising media spend, so further growth in online's share of total advertising can only make a much more modest contribution to the growth of these companies. Relatively untapped markets that have the potential to become very large (for example, technology enabling the Internet of Things or autonomous driving) represent greater growth opportunities from today's starting point.
- Network effects. Some business models have a positive network effect – meaning that customers will gain the greatest benefit from going with the provider that has the greatest market share. Obvious examples include social networks (no-one wants to join a network where they don't know anyone), or Microsoft's Office Suite and Adobe's Creative Suite (where businesses choose to use the market-leading software packages, because it makes it easier to share files with other companies, and because their employees are familiar with those software packages).
- Absence of competition. An obvious market growth opportunity is not always a positive thing, as it can attract a lot of competition from other companies that want to grab a slice of the pie. This is particularly the case in sharemarket environments such as we’re seeing at the moment, where high valuations of growth companies encourage venture capitalists and company boards to allocate capital to chasing the next hot thing. High levels of competition for a growth market can lead to a situation whereby most market participants lose money despite strong aggregate growth in volumes. The telecommunications industry suffered for many years from poor returns due in part to competitive network-building that had started during the TMT boom of the late 1990s, and there is a risk that amount of money being poured into developing electric vehicles may lead to a similarly competitive environment.
- A still-compelling value proposition for customers. Companies will have far greater potential for ongoing growth if the majority of their customers feel that they’re getting far greater value than they’re paying for, and therefore rarely leave once they’ve signed up. On the other hand, if a company has pushed pricing to the point that customers are questioning whether they’re getting value for money, further growth become a lot more difficult. This is part of the reason why Microsoft and Netflix have continued to grow their subscriber bases, but growth rates stalled for $100 mobile phone plans, Sky TV, and Norton Anti-Virus software.
Be Careful!
In the current market environment, investors pay a high price for a track record of growth, but growth inevitably fades. It is easy to forget that the strongest percentage growth rates will typically be achieved well before a company achieves a significant market share.
In the graph below, I have attempted to demonstrate what might be an archetypical growth path for a company that ultimately achieves fantastic growth success, building from a 3% market share to an 80% market share over a period of 30 years, while its target market grows at 3.5% per annum. Based on the assumptions that I have used for this graph, the company starts out growing at 33% per annum, but by the time it is achieving the strongest market share growth in year 13, its growth rate has reached its “half-life”, by slowing down to 16.7%. Using what I think are some realistic assumptions about returns on invested capital and discount rates, this company could be valued at 190 times earnings in year zero (if its future growth was truly foreseeable) and 17.5 times earnings by year 30. From a discounted cashflow perspective, these same assumptions would dictate that the company should be worth 30 times earnings when it is hitting 40% market share in year 13.
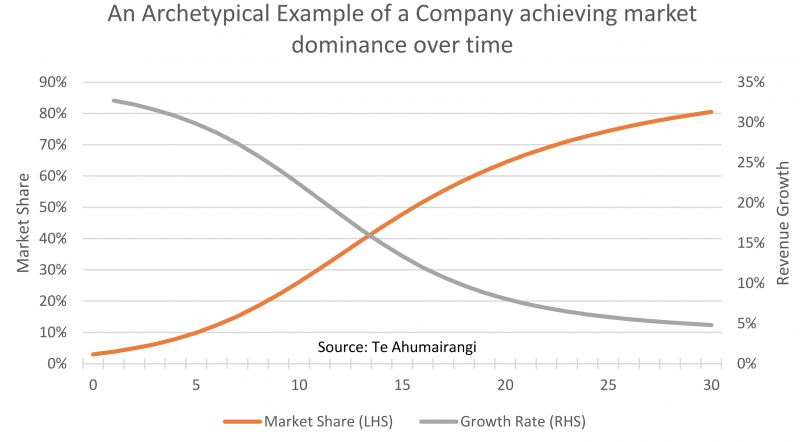
In the current market environment, a lot of companies attracting high valuation multiples are arguably sitting at somewhere around year 15 in the graph above. Investors are looking back at their historical track record of strong growth, and failing to see the inevitable slow-down ahead. If investors want to play this game of investing in established growth companies, they need to be careful to distinguish those companies with a long growth path ahead of them from that are likely to experience a more sudden growth-fade.
Disclaimer: This article is for informational purposes only and is not, nor should be construed as, investment advice for any person. The writer is a director and shareholder of Te Ahumairangi Investment Management Limited. Te Ahumairangi manages client portfolios that hold shares in the following companies mentioned in this article: IBM; Walmart; Apple; Amazon; BHP Billiton; Alphabet; Facebook; and Microsoft.
In the current market environment, investors pay a high price for a track record of growth, but growth inevitably fades