The Limits of Quant
NBR Articles, published 19 August 2025
This article, by Te Ahumairangi Chief Investment Officer Nicholas Bagnall,
originally appeared in the NBR on 19 August 2025.
For investors experienced in fundamental analysis, quantitative investing (“quant”) can seem too simple to work. But some quantitative fund managers have achieved very strong results historically, and there is no clear empirical evidence that fund managers using quantitative approaches to investing have performed any worse than qualitative research-based investing.
Why “real investors” are often sceptical about quant
Fundamental investors make a habit of trying to understand the factors that are driving a company’s performance. They won’t just look at a company’s growth, profitability, and historical cash generation as numbers on a spreadsheet, but will also try to understand the underlying causes behind a company’s profitability or growth or cash generation. Sometimes, this analysis will lead them to conclude that a period of strong profitability or growth or cash generation is likely to be temporary (such as when a company has benefited from an industry cycle or an exceptional circumstance such as the covid pandemic) but on other occasions they’ll form a view that the circumstances that have led to strong profitability or growth or cash generation are likely to persist or even become stronger in the future.
Fundamental investors sometimes like to laugh at quants who pile into a stock that is “cheap” when measured against earnings that have benefitted from some clearly temporary factor or chase “a strong grower” between the trough and the peak of a known commodity cycle. And when they look at the share registers of eye wateringly expensively valued companies like Palantir and Strategy (formerly MicroStrategy) they often see an abundance of quant funds and weird ETFs, but an almost complete absence of holdings by professional managed funds using fundamental research. They smugly think to themselves “we would never do anything that silly”.
Why quant can work
Investing based on fundamental research can also have some serious shortcomings, and quantitative investing can avoid these shortcomings and take advantage of how they affect market pricing.
Fund managers engaged in fundamental research cannot possibly cover the entire investment universe. Hence, they often spend most of their time looking at companies they already know, the largest companies in their investment universe, or those companies that they keep on hearing about because of abundant media or sell-side research coverage. In doing so, they will often overlook many relatively unknown companies that don’t get a lot of media or research coverage.
If fund managers using fundamental research are overlooking some companies, those companies will tend to trade at lower valuations, creating opportunities for quantitative investors. Investing in stocks that seem under-valued because no professional investor has bothered to have a proper look is obviously a far safer approach than investing in companies that seem under-valued because every professional investor who has looked at them before you had decided to pass.
Finding overlooked stocks fuelled the returns of pioneering quantitative investors, but is less likely to work in the modern era now that (1) there are far more competing quantitative funds, and (2) every fundamental research-based fund manager now has tools on their desktop that allow them to quickly screen the investment universe for stocks with particular characteristics. In 2025, most “qualitative” fund managers use at least some form of quantitative screen to identify companies that may deserve a closer look.
But there are deeper problems with how fund managers make decisions using fundamental research that can lead to opportunities for quantitative investors. When analysts really try to understand a company and use this understanding to assess its investment merits, they are often doing so without a strong empirical basis for knowing what is important for predicting future returns.
When fundamental analysts and fund managers make judgements about companies, these judgements are often strongly grounded in their personal intuitions. In some case their intuition may be based on what they’ve observed in hundreds of other companies in similar circumstances, but in other cases their intuition will be strongly influenced by just one or two formative experiences. At a deeper level, investment intuitions may also be influenced by childhood experiences or genes that are not necessarily helpful for making investment decisions.
We all have cognitive biases routed in our past experiences and our genes, and in many cases, these biases are shared across so many different investors that they have a significant influence on market pricing. To list just a few examples of common biases, market participants can collectively:
- fall too much in love with a good story;
- overlook “red flags” that point to inconsistencies in a company’s financial statements;
- be slow to revise expectations in response to new information;
- ignore risk after a period of strong market performance;
- extrapolate growth rates for far longer than historical evidence suggests that it normally persists; or
- ignore the balance sheet funding requirement of continued growth.
All of these biases can distort market pricing in a way that quantitative investors can exploit. If you were the only quantitative fund manager in the world, there would be a fantastic opportunity to profit from the behavioural biases arising from qualitative decision making. You can see evidence of this in the strong track records of some of the value investors operating prior to the computer age, and in the track records of the first investors to use computers to undertake modern quantitative funds management.
The quantitative approach is essentially to test what quantifiable characteristics have historically helped on average to predict returns from individual companies, and to score companies on several different criteria to generate a composite score of investment attractiveness.
Quantitative managers find value in a lot of quantitative indicators that might individually work 55% or 60% of the time, figuring that if they combined several of these indicators to generate a composite score, that composite score might work 75% or 80% of the time.
In some cases quant managers will even use indicators that don’t individually help predict performance, but which can help to offset the biases of another indicator. For example, growth rates measured in isolation have not historically been a good indicator of future investment performance, but they can nonetheless help to improve the predictive ability of valuation metrics. Cheap companies that are growing produce better returns that cheap companies that are not growing, and expensive companies that are not growing are a more dangerous proposition than expensive companies that have shown consistent growth.
Other quantitative indicators may help to predict investment performance in certain segments of the market, even if they do not work for all stocks.
It is important to understand that while many fundamental investors often spend most of their time trying to identify companies that have the potential to rise five- or ten- fold, quantitative analysis cannot pretend to generate insights that will help to identify such companies. Instead, quant is all about finding indicators that work on average (i.e. more than 50% of the time) and combining many of these indicators across many of these stocks to hopefully arrive at something that will work most of the time.
Are we approaching peak Quant?
The logic behind quant investing is strong, provided that quant investing in aggregate does not become too big a share of the market. As we have discussed, quant investing feeds on the psychological biases of active investors making decisions based on qualitative judgment. If there are more quant funds feeding on the psychological biases of fewer qualitative investors, do the quants begin to starve?
The dominant shift in how money is managed over the past one to two decades has been the increasing share of the market that is managed passively. While this shift has received a lot of attention, less attention has been focussed on where this money has been coming from.
We can roughly divide the actively managed portion of the share market into 3 categories:
- Professionally managed funds using qualitative judgements based on fundamental research.
- Quantitatively managed funds.
- Retail investors, which is admittedly a broad category, as it includes both retail investors who follow research-supported advice provided by their brokers as well as fully self-directed investors (increasingly on platforms such as Robinhood, Interactive Brokers, Sharesies, and Hatch). Some self-directed retail investors do a lot of fundamental research, but others follow their whims or the opinions of others on chat forums.
Straddling the gap between “passive” and “active quantitative”, there are also the “smart beta” funds and ETFs, which typically follow a relatively naïve strategy of selecting investments based on a single quantitative criteria.
Over the past decade, as a greater and greater proportion of the ownership of global share markets has flowed into passive investment vehicles, it has not been flowing out of all forms of active management in equal proportion. Although there is no reliable source of data on how much money is managed according to each investment approach, the pie charts below present my best guess as to how the landscape has changed for management of equity portfolios over the past 15 years.
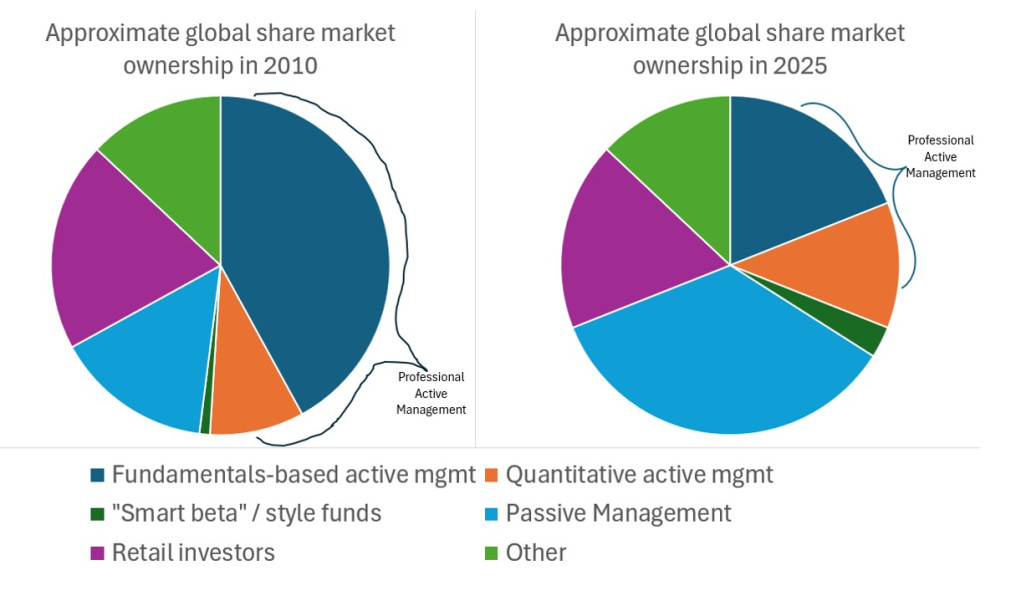
The important point I see here is that the flow of money out of active into passive has come mainly out of professional fund managers who make qualitative decisions based on fundamental research. In contrast, I believe that the proportion of the market managed according to quantitative approaches has increased, and hence the proportion of actively managed funds being managed according to quantitative approaches has increased significantly.
Quantitative investors have always made a few ‘bloopers”, investing in companies that scored well on a few quantitative metrics, but which (to a fundamentals-based investor) were priced too expensively relative to the future cash that they could conceivably return to investors. Historically, this was not historically a big deal, as the psychological biases of other investors generated enough opportunities for quants to exploit that they could generate good average results despite the occasional blooper.
Looking forward, I would be concerned that quantitative funds will be over-competing to exploit indicators that have worked in the past, and may therefore stop seeing much profit from the biases of qualitative investors, whilst the bloopers could become a more significant drain on performance.
There is a volatility bias inherent in quantitative testing
When quants test how a quantitative indicator has performed in the past, they typically do this by looking at how the best 20% of stocks scored using this indicator have performed relative to either the broader universe or relative to the worst 20% of stocks (ranked according to the same indicator), by comparing the two groups based on average monthly returns. They compare the difference in monthly returns to the standard deviation of that difference to measure its statistical significance. Finance academics also typically follow this approach.
Using average monthly returns makes a lot of sense when you want to test statistical significance. It also makes sense for quants who are combining several indicators to arrive at a composite quantitative score, as if you overlay several different investment strategies, you should expect that the average return from the various strategies combined will be linked to the weighted average return of the various strategies. The average monthly return difference of the best 20% minus the worst 20% of stocks is of particular relevance to quantitative hedge funds, which often carry both long and short positions.
However, one point that most quantitative investors and academics seem to totally ignore is that as soon as you start measuring performance based on average monthly returns, you create a bias in favour of volatile stocks. This is point that is particularly close to my heart, as at Te Ahumairangi we favour lower risk investing, and as such we are effectively betting against a lot of quant funds’ bias toward more volatile stocks.
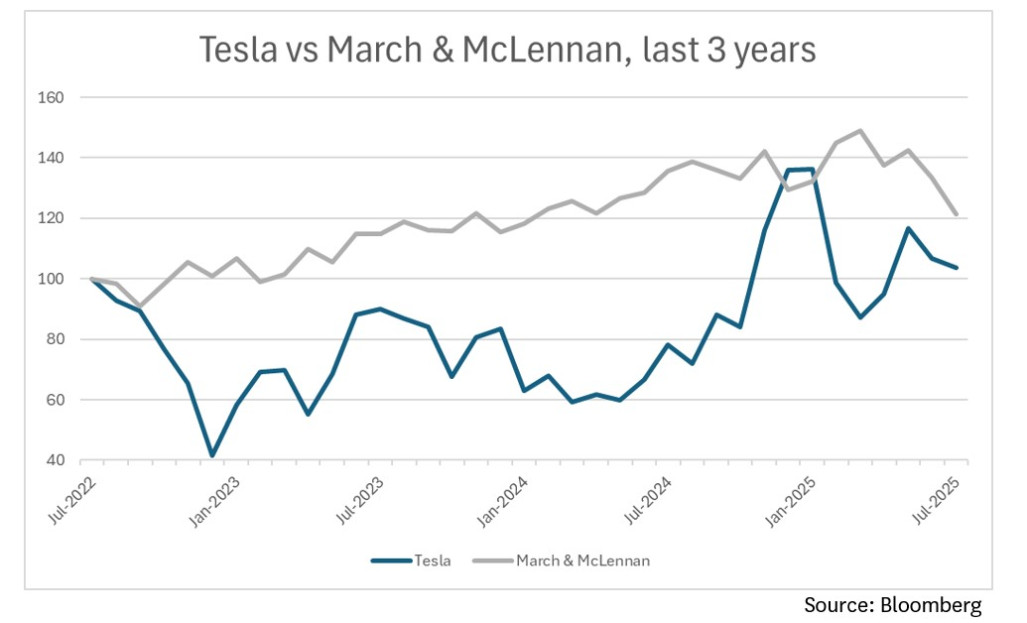
Good average monthly returns do not translate to good cumulative returns if a stock is particularly volatile. Consider this: over the past 3 years, the average monthly US dollar return from investing in Tesla stock has been +1.70% while the average monthly return from investing in the stock of Marsh & McLennan (which owns the insurance owner Marsh and the investment advisory firm Mercer) has been +0.68% per month. Which do you think has been the better investment over that period?
If you answered “Tesla” then you made the same mistake as scores of quant funds and finance academics, who like to measure the performance of investment strategies based on average monthly returns. While Tesla’s average monthly return was +1.70% over the 3-year period, it’s total return over the full 3 years was just +3.74% (in USD). In contrast, Marsh & McLennan’s average monthly return has been +0.68% but it has generated a total return of +21.49% (in USD) over the same 3-year period.
This somewhat counter-intuitive result arises because it always takes a bigger percentage rise to offset a decline. If you lose 20% of your money one month, you need a 25% gain the next month to get back to break-even. After two months you’re square, but your average monthly return has been +2.5%!
We see this clearly when we back-test a strategy of investing in lower risk stocks. Using the back-testing function on Bloomberg, I can see that if I’d bought the least volatile 20% of stocks in the MSCI US index each month over the past 20 years, I’d have achieved an average US dollar return of +0.79% per month, whereas if I’d invested in the most volatile 20% of stocks I would have achieved an average return of +0.65% per month. This 0.14% difference in average return is too small to be interesting to most quantitative investors, yet over 20 years it has been the difference between a +496.0% return from the least volatile 20% of stocks vs a +138.7% return from the most volatile 20% of stocks.
The problem of back-testing over the recent past
The fundamental assumption behind quantitative testing is that stock selection criteria that have worked in the past are likely to continue to work in the future. Quants know that there is a danger in trading on every indicator that seems to work, so they look for results that are statistically significant, which often means that they need at least 5 years of data.
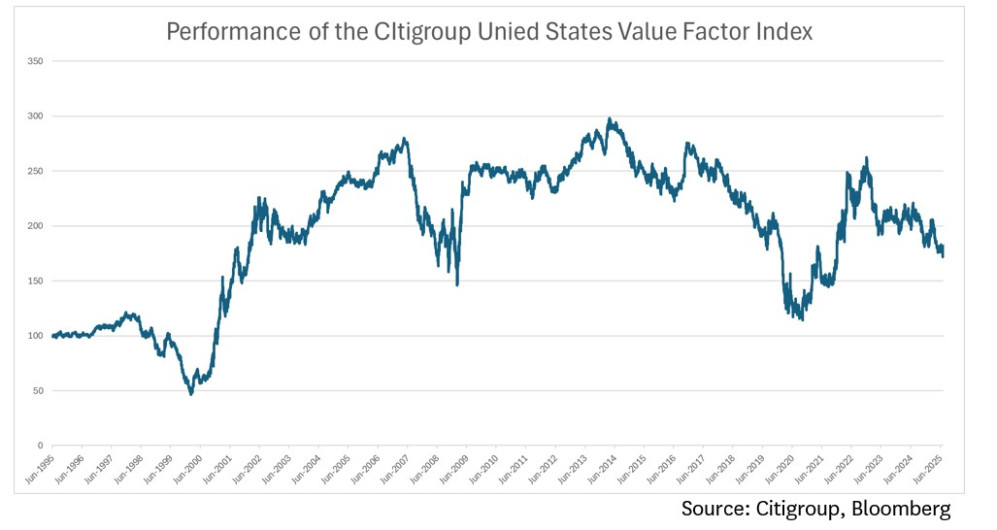
However, the performance of different investment styles goes through cycles in the equity market, which often seem to last about 5 to 7 years. For example, value investing in the United States did poorly between 1995 and 2000, produced spectacular returns between 2000 and early 2007, crashed between early 2007 and early 2009, performed well between early 2009 and early 2014, did appallingly between early 2014 and late 2020, did extremely well from late 2020 to the end of 2022, and have been lagging since the end of 2022. A quantitative fund that had been back-testing how value would had historically performed would have seen the worst results in 2000, 2009, and 2020 (just prior to the periods where value did well) and would have seen the best (most validating) results in 2006 and 2014 (just before it did particularly poorly).
A large part of the reason why markets move around in cycles like this is undoubtedly that all investors (qualitative and quantitative alike) are continually modifying their investment approaches based on experience. For example, after an initial period of value investment performance, more and more investors begin to pay attention to valuation metrics, which contributes to value stocks continuing to outperform for a further period.
The fact that the performance of investment indicators such as valuation multiples can swing around so much from one period to the next is a challenge for quantitative investors who rely on the assumption that what worked in the recent past will work in the future.
There are many approaches to solving this issue, but they each involve making judgements based on a limited set of data, which essentially places quantitative investors in the same world as fundamental research driven investors, of having to make judgements about things which they don’t have enough data to resolve definitively.
Conclusion
Quant would be great if you were the only person doing it, but right now there is probably a higher proportion of active funds being managed according to quantitative approaches than ever before. This creates a risk that quantitative approaches have become crowded, such that we may see some very disappointing results from quantitative funds over the next few years.
Nicholas Bagnall is Chief Investment Officer of Te Ahumairangi Investment Management
Disclaimer: This article is for informational purposes only and is not, nor should be construed as, investment advice for any person. The writer is a director and shareholder of Te Ahumairangi Investment Management Limited, and an investor in the Te Ahumairangi Global Equity Fund. Te Ahumairangi manages client portfolios (including the Te Ahumairangi Global Equity Fund) that invest in global equity markets. These portfolios own shares in Marsh & McLennan, which was mentioned in this article.