US Equities are unusually expensive
NBR Articles, published 26 November 2024
This article, by Te Ahumairangi Chief Investment Officer Nicholas Bagnall,
originally appeared in the NBR on 26 November 2024.
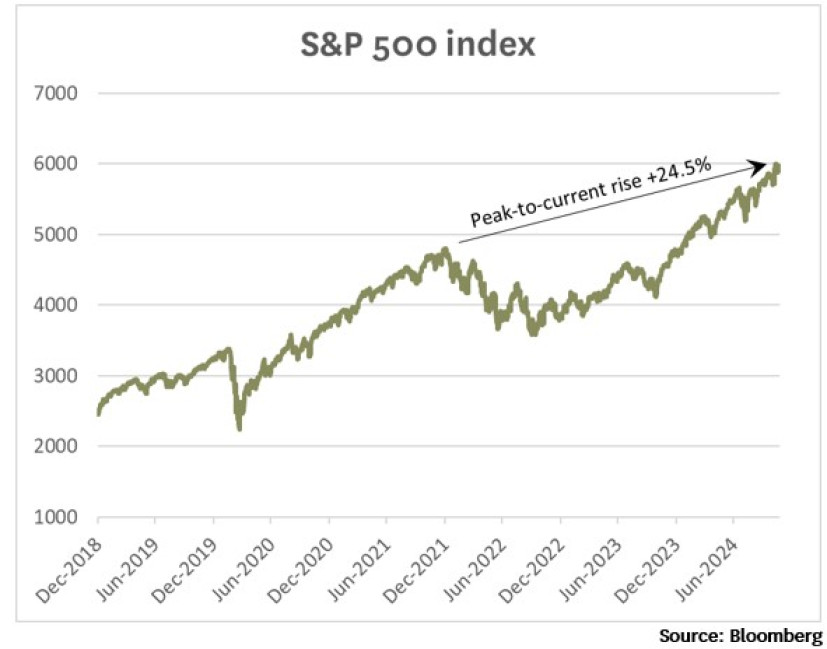
US Equities climbed to new highs earlier this month, seemingly buoyed by expectations that Trump’s tax cuts and tariffs will boost the profitability of US corporates. As of Friday, the US share market (as measured by the S&P 500 index) was 24.5% above its previous significant peak (which occurred on the first business day of 2022).

If we look back even further, the S&P index has risen 5.7% per annum since the peak of the previous tech bubble in March 2000.
US Market Capitalisation is at record levels relative to GDP
The total capitalisation of the US equity market has risen 6.8% per annum since the March 2000 share market peak, significantly faster than the 4.5% growth in nominal GDP over that same period.
The total capitalisation of the US equity market is now about US$60 trillion, representing about 205% of US GDP. This market capitalisation to GDP ratio is significantly higher than it has been at any previous market peak.
The ratio of market capitalisation to GDP is relevant, because the value of the share market should in theory be linked to the ability of corporates to generate earnings, and all corporate earnings are ultimately sourced from the economy. Of course, not all United States corporate earnings are sourced from the United States economy, and (contrary to some people’s perceptions) this has always been the case. About 35% to 40% of the revenues of US corporates today are sourced from outside the United States, and this was also the case if we look back 20 years ago, when companies like General Electric, Exxon Mobil, Pfizer, and IBM dominated the US share market.
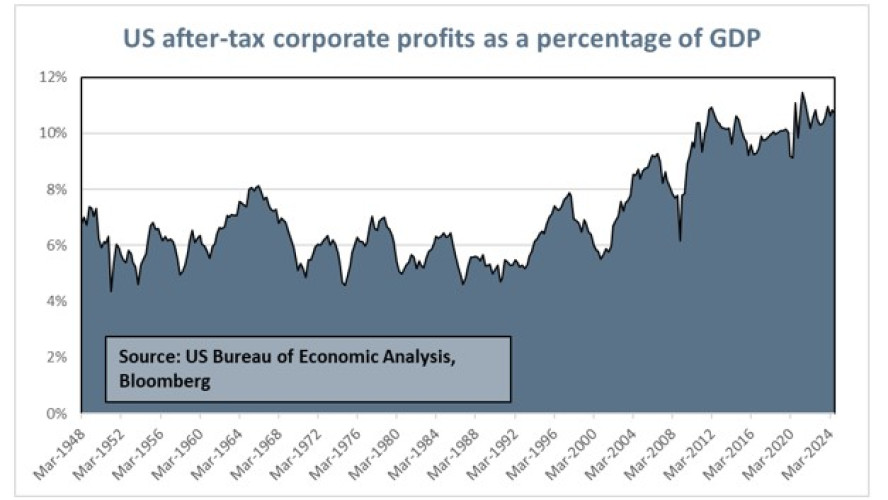
The record ratio of US share market capitalisation to GDP reflects the fact that both the ratio of share market value to corporate earnings and the ratio of corporate earnings to GDP are currently at very high levels. Previously, we’ve often had just one or the other (high profitability or high multiples). Now it is different: investors are paying high multiples for peak profits, effectively making a bet that neither profitability nor P/E multiples will ever revert to their historical averages.

As I discussed in my September column, low US corporate tax rates and high fiscal deficits are a key contributor to the elevated level of US corporate profitability. The election of Trump means that US corporate tax rates are likely to stay low for at least another 5 years, but the recent appointment of Scott Bessent as secretary of the US treasury means that there is nonetheless a risk that the US may try to reduce its fiscal deficit, which would likely create headwinds for US corporate profitability.
Price / Earnings (“P/E”) Multiple
In aggregate, the US equity market is being valued at about 25.5 times trailing earnings, which translates to an earnings yield of less than 4%.
The market has been priced on more than 25 times trailing earnings on quite a few occasions in the past, but this has generally been because earnings were temporarily depressed. The only times in the past where P/E multiples have been this high while earnings were close to record highs were at the peak of the TMT bubble in late 1999 / early 2000 (prior to the “tech wreck”) and shortly before the market peak in 2021 (prior to the 2022 share market slump).
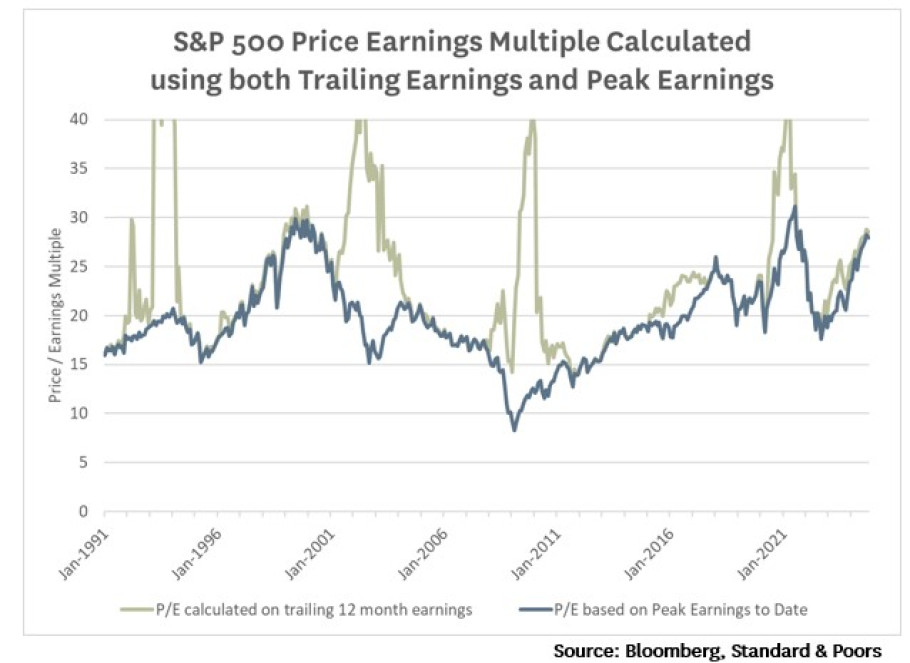
In the graph below, I show the history for the Price/Earnings multiple of the US Equity market, calculated in two different ways. The light green line shows a simple price/earnings ratio defined as the level of S&P 500 index level divided by the earnings per share of that index over the prior 12 months. The blue line takes a slightly different approach, calculating a Price/Earnings multiple based on the highest level of earnings per share that has ever been recorded up to the date of calculation. As corporate earnings have generally risen over time, this peak level of earnings per share has always been a level of earnings that was reached some time in the previous 5 years.

As the graph shows, the simple P/E multiple calculated using trailing earnings has spiked up to 40 on four separate occasions in the past 33 years. However, when we look into the reasons for these spikes in the P/E multiple, in each case the P/E multiple rose because earnings (the “E”) dropped, and in three of these cases there was no significant spike in share prices (the “P”). A P/E multiple calculated from a depressed level of recent earnings can generate a false signal that equities are expensive, as dips in earnings have often tended to be quite short-lived, generally caused by recessions or financial meltdowns.
The blue line, which calculates P/E multiples based on the highest level that corporate earnings have ever reached is far less likely to deliver a false signal which wrongly indicates that equities are expensive. This can be seen if you contrast the two different P/E readings in 2009, during the aftermath of the global financial crisis. The simple P/E based on trailing 12-month earnings indicated that US equities were unusually expensive, as they were trading at a high multiple of earnings over the previous 12 months. By contrast, the P/E ratio calculated based on peak earnings (achieved in 2007) indicated that US equities were unusually cheap. History has shown that the indicator based on peak earnings gave the better signal, as early 2009 proved to be a great time to buy US equities.
However, even the P/E multiple calculated on peak earnings is now indicating that US equities are unusually expensive. The only other times when US equities have appeared more expensive on this measure was a period of 6 months in mid-2021 and 13 (non-continuous) months over 1999 and 2000. In total, the periods when US equities have been more expensive than they are today represented less than 5% of the historical period shown in the graph. For the remaining 95% of the time, US equities were cheaper than they are today.
The P/E multiple calculated based on peak earnings per share has historically proven to be a good forward indicator of returns, with a correlation of -0.36 between this multiple and S&P 500 returns over the subsequent 3 years. If you bought the S&P 500 on one of the few months when the multiple to peak earnings was over 27 (which occurred on just 25 months between January 1991 and November 2021), you experienced an average loss (in USD) of -8.3% in the subsequent 3 years. By contrast, when you bought US equities on multiples of 22 or less, you historically enjoyed an average gain of +45.7% over the following 3 years. (Moderately expensive multiples of between 22 and 27 generated an average return of +26.3% over the subsequent 3 years). On average, US equities have delivered good returns over the past 33 years, but not when they were purchased on multiples as high as we’re seeing today.
“Earnings are understated”
Defenders of the US equity market will sometimes say that reported earnings are understated, pointing to instances where the reported earnings of a company seems to understate its economic ability to generate cash for investors. In particular, they will point to companies that are amortising (i.e. gradually writing down) acquired intangible assets such as customer relationships, patents, and other intellectual property. They may also point to companies that have made provisions for restructuring and argue that these restructuring costs are one-off in nature.
I don’t think these arguments stand up to much scrutiny.
There are always a few companies incurring some restructuring charges, and while these costs tend to be lumpy (“one-off”) at the individual company level, they are real and recur every year when you look at the market in aggregate. If anything, restructuring charges are currently low by historical standards, reflecting a pattern whereby restructuring costs (aggregated across the market) run at below-average levels when the economy is doing well, but spike up to higher levels during recessions.
The argument that reported earnings should be adjusted for amortisation of acquired intangibles is stronger, as there are clearly some intangible assets that are being written off by some companies even though the value of the acquired business is not actually declining. But in other cases the amortisation of intangibles seems to be a fair reflection of the economic reality, such as when a pharmaceutical company buys a biotech company that has developed a drug, and writes off the book value of that drug over the remaining life of the patent.
In any case, the potential under-statement of earnings due to amortisation of acquired intangibles does not really move the needle in terms of the aggregate level of earnings. For example, I estimate that in aggregate, the Magnificent Seven (Nvidia, Apple, Microsoft, Alphabet, Amazon, Meta, Tesla) are amortising a total of no more than US$8 billion of acquired intangibles each year (excluding acquired programming content at Amazon) whilst reporting profits of US$460 billion. Hence, at most you can argue that the Magnificent Seven’s reported earnings are under-stated by 1.7% due to amortisation of acquired intangibles.
In other respects, I believe that many US corporates are over-stating earnings. For example, the hyper-scalers (Amazon, Microsoft, Alphabet) are now writing off computer servers in a straight line over 6 years, based on the argument that these servers typically stay in use for 6 years. But the fact that these servers stay plugged in for 6 years before being sent to the landfill does not mean that they only fall in value by one third over the first 2 years. Rather, computing power is improving at such a rapid rate that the true economic value of a 2-year-old server will typically be less than half of what it cost two years prior.
When we’re comparing P/E multiples today to P/E multiples during the 2000 TMT bubble, it is worth bearing in mind that accounting standards have changed since then, and that companies used to amortise goodwill, but no longer do. Some of the largest companies in 2000 (such as General Electric and Cisco) were reporting earnings back then that were about 15% lower than would have been reported if they had applied 2024 accounting standards for the treatment of goodwill.
Earnings yields vs bond yields
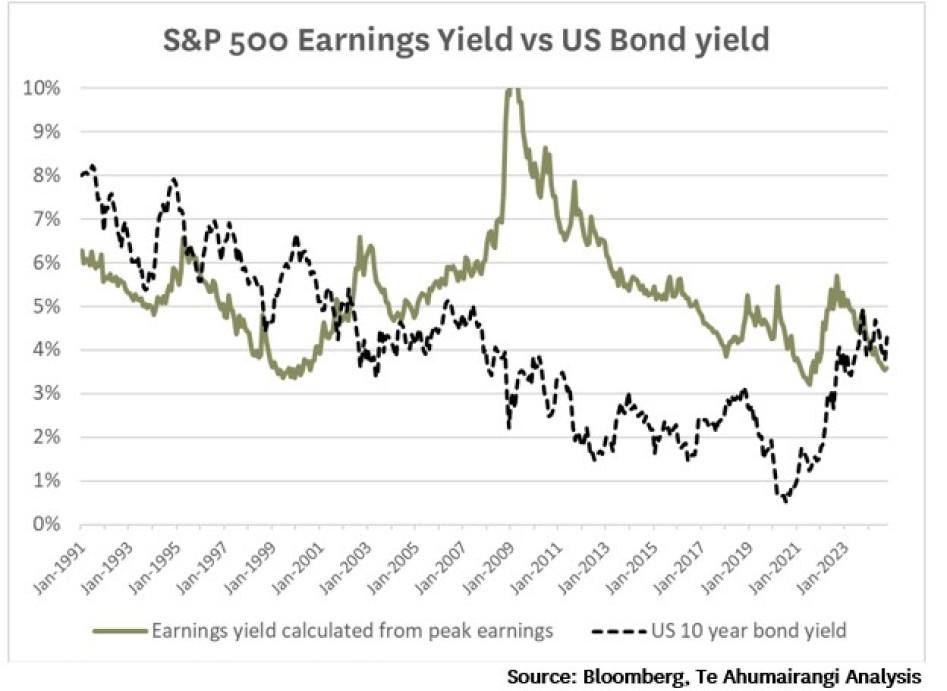
The last market peak in late 2021 / early 2022 was supported by particularly low bond yields. Although the earnings yield on equities was unusually low by historical standards, one could argue that this was justified, because the yield on the main alternative to equities (i.e. bonds) was even further below its historical average.
At the end of 2021, the yield on US 10-year government bonds was just 1.5%. From this starting point, it could have been argued that investors should only require a long-run return of about 5.5% per annum from US equities (i.e. a 4% risk premium), and that it was easy to envisage how US equities could deliver a long-run return of 5.5% or more even from the high equity valuations that were prevailing in 2021.
However, US 10-year bond yields have now risen to 4.4% (see graph below), exceeding the earnings yield on US equities for the first time in over 20 years.

For US equities to deliver a 4% risk premium over bonds, they would need to return 8.4% per annum. What can we actually expect?
The dividend yield on the US equity market is currently 1.25%, so if earnings per share and share prices grow in line with GDP growth of 4.5% per annum, maybe a 5.75% return is likely over the long run.
However, an argument could easily be made that with an earnings yield of almost 4%, US companies could afford to payout a greater proportion of earnings to shareholders, maybe delivering a yield of up to 2.5% per annum through dividends and net buybacks, thereby generating a total return to shareholders of as much as 7% per annum (2.5% cash return plus 4.5% growth) over the long run. This would provide a risk premium of 2.6% per annum over bonds, which is low by historical standards, but still enough to justify a significant allocation to US equities for many investors.
US Equities vs non-US equities
While the US share market is currently valued at about 25.5 times trailing earnings (an earnings yield of 3.9%), equities in the rest of the developed world are currently being valued on about 14.2 times trailing earnings (an earnings yield of 7.0%).
The fact that non-US equities have a 3% higher yield than US equities seems particularly non-sensical when you consider that bond yields in Japan, Europe, and Canada are significantly lower than US bond yields. For example, while the earnings yield on US equities is about 0.5% lower than the yield on US government bonds, the earnings yield on Japanese equities (6.5%) is 5.4% higher than the yield on Japanese government bonds.
Related to this, returns from equities in Europe and Japan can be significantly enhanced when hedged to US dollars, due to the US dollar trading at a significant forward discount in currency markets. If you can build an equity portfolio in Japan that you expect to deliver a long run return of just 5% per annum in Japanese yen terms, this can be hedged into US dollars to generate a US dollar return of 8.6% per annum.
What should investors do?
If you accept my argument that US equities are over-valued, a natural response might be to sell all your equities and sit in cash.
The risk with doing this is that you might join a long list of people who have been persuaded by some doomsayer’s arguments, and have therefore sold out of equities and sat in cash for several years, watching from the sidelines as the equity market continues to achieve new highs.
Identifying that a market is over-valued does not help much for picking when it may fall. I know this from experience: as a 29-year-old Investment Strategist at ACC in 1998, I formed the view that global equity markets were significantly over-valued and began to reduce ACC’s allocation to global equities. This ultimately saved ACC a lot of money when global equities tumbled between early-2000 and early-2003, but prior to this I experienced about 20 months of being wrong, as the TMT bubble continued to inflate. (I was lucky to keep my job until the bubble burst: some other asset allocators who took a similar view to me lost their jobs before they were ultimately proven correct).
Rather than allocating completely out of equities, investors could “hedge their bets” by looking for global equity funds that do not have allocations of 65% or more to US equities. Equity markets outside of the United States are generally priced far more reasonably than the US equity market, and for this reason I believe that they generally have a greater prospect of delivering attractive long-run returns, and are likely to out-perform the US market in the event of a major market correction.
Nicholas Bagnall is Chief Investment Officer of Te Ahumairangi Investment Management
Disclaimer: This article is for informational purposes only and is not, nor should be construed as, investment advice for any person. The writer is a director and shareholder of Te Ahumairangi Investment Management Limited, and an investor in the Te Ahumairangi Global Equity Fund. Te Ahumairangi manages client portfolios (including the Te Ahumairangi Global Equity Fund) that invest in global equity markets. These portfolios hold shares in the following companies mentioned in this column: Microsoft, Apple, Alphabet, Meta, and Amazon. The portfolios managed by Te Ahumairangi hold a weight of about 46.5% in US equities, markedly lower than the 73.5% weighting that United States has in the MSCI World index.