When the same set of future cashflows trades at two different prices
NBR Articles, published 25 August 2026
This article, by Te Ahumairangi Chief Investment Officer Nicholas Bagnall,
originally appeared in the NBR on 25 August 2026.
It is a fundamental tenet of investing that the fair value of any investment is the discounted present value of all future cashflows that it is expected to deliver to investors.
Further, most investors would agree that the appropriate discount rate for valuing those cashflows should be determined soley by the time value of money and the risk characteristics of the anticipated future cashflows.
From this starting point, you might expect that when the same set of future cashflows are packaged up in two different investment vehicles, the two investment vehicles would trade at roughly the same price.
This is logical, but the investment world doesn’t always behave rationally.
A recent example of this has been Korean memory chip maker SK Hynix’s 10th of July listing of ADRs (American Depository Receipts) on the US equity market. The listing of SK Hynix ADRs was not some minor sideshow – in fact, at the time it was the largest initial public offering in the history of the US Equity market (although it was massively eclipsed a few days later by the SpaceX IPO).
Each SK Hynix ADR owns one tenth of an SK Hynix ordinary share, and is therefore entitled to one tenth of the dividends paid on an SK Hynix share (minus some small deductions to pay the depository bank managing the ADR scheme).
In a rational world you would expect SK Hynix ADR’s to trade at one tenth of (the US dollar equivalent of) SK Hynix’s Korean share price. But in the world we’re actually living in, they are trading at 13.1% of SK Hynix’s share price, representing a 31% premium to the market value of the underlying SK Hynix shares.
On the day the SK Hynix ADR’s first traded (after being sold to US investors at about parity to the Korean share price), this premium (vs one tenth of as SK Hynix share) was 14.7%, and it has since ranged between 15% and 60%. You can see how the size of that gap has tracked in the graph below.
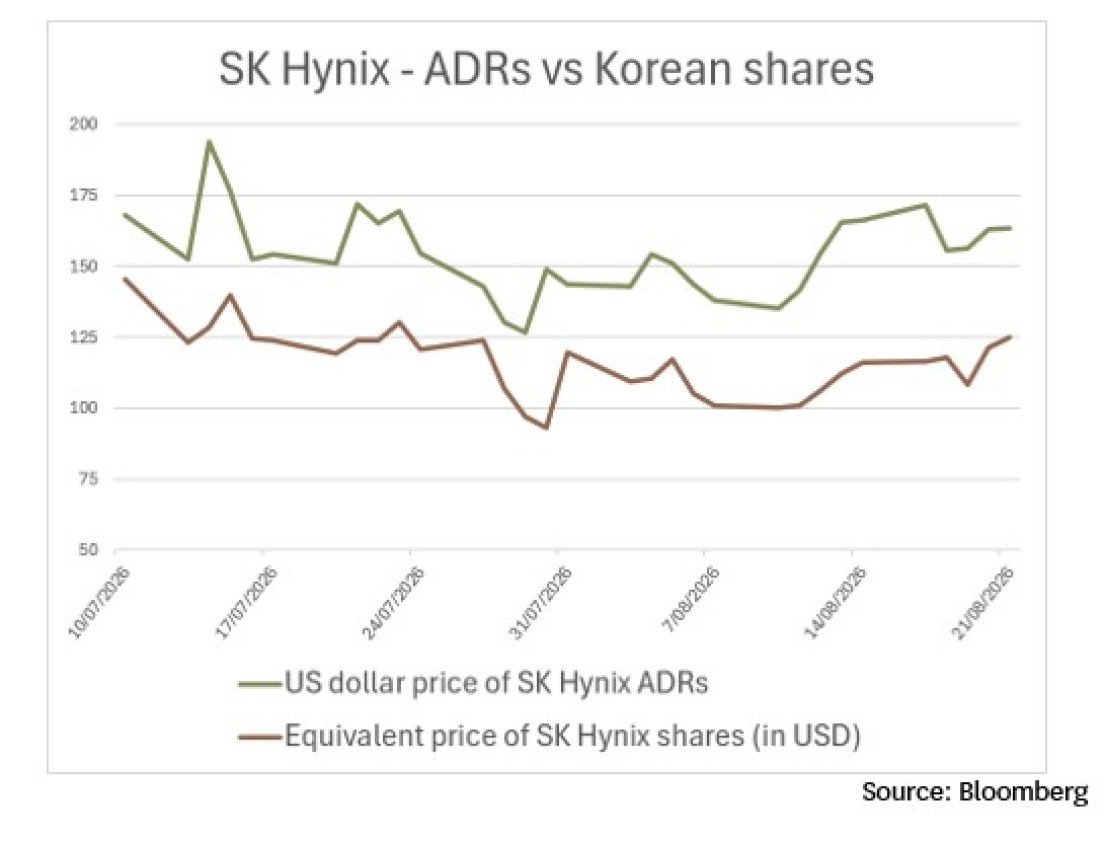
The SK Hynix ADRs differ from many other ADRs in that they are not fungible, meaning that investors are practically unable to exchange SK Hynix shares for SK Hynix ADRs. Most ADRs are fungible, but ADRs on Korean and Taiwanese companies often lack practical fungibility, as they impose limits on how many shares may be converted to ADRs.
Further, investing directly into Korean or Taiwanese shares is practically more difficult than is the case with other developed markets, as you need to (1) apply for an investor ID and use it with each transaction and (2) only deal with your custodian bank when buying the local currency. For Taiwan, there are even more hoops to jump through, as you need to (a) appoint a tax agent for Taiwan and (b) pre-fund any equity purchases in Taiwan. The hassle and cost of jumping through these hoops puts direct investment in Taiwanese and Korean shares out of reach for most individual investors, which means that ADRs can represent a good way for retail investors to invest in Korean and Taiwanese companies.
However, investors are accepting a huge handicap if they invest in ADRs while they are trading at a 30%+ premium to the underlying shares. If investors in the underlying SK Hynix shares get a fair return from their investment, then by definition, investors in the ADRs will almost certainly end up with a less-than-fair return over time.
Using a scenario for future dividends that would deliver an 8.49% internal rate of return to SK Hynix shareholders if the shares are held in perpetuity, holders of the ADRs would only get a 7.60% internal rate of return (if they also hold the ADRs into perpetuity). If you never sell, all the return that you get from an equity investment comes from the dividends that it pays, and if you pay a 31% premium to the underlying share price, the dividends you get will be 24% lower than if you’d invested the same money in the underlying shares (hence the lower return over time).
Of course, many investors in the ADRs expect to hold their ADRs for a lot less than eternity. In fact, an average of 23% of SK Hynix’s outstanding ADRs have traded each day since issue, implying an average holding period of just 4.4 days! But if we stretch out the time horizon from a few days to a few years, we can see from the experience of other non-fungible ADRs that paying 30% premiums to the underlying share price is likely to be severely detrimental to your future returns.
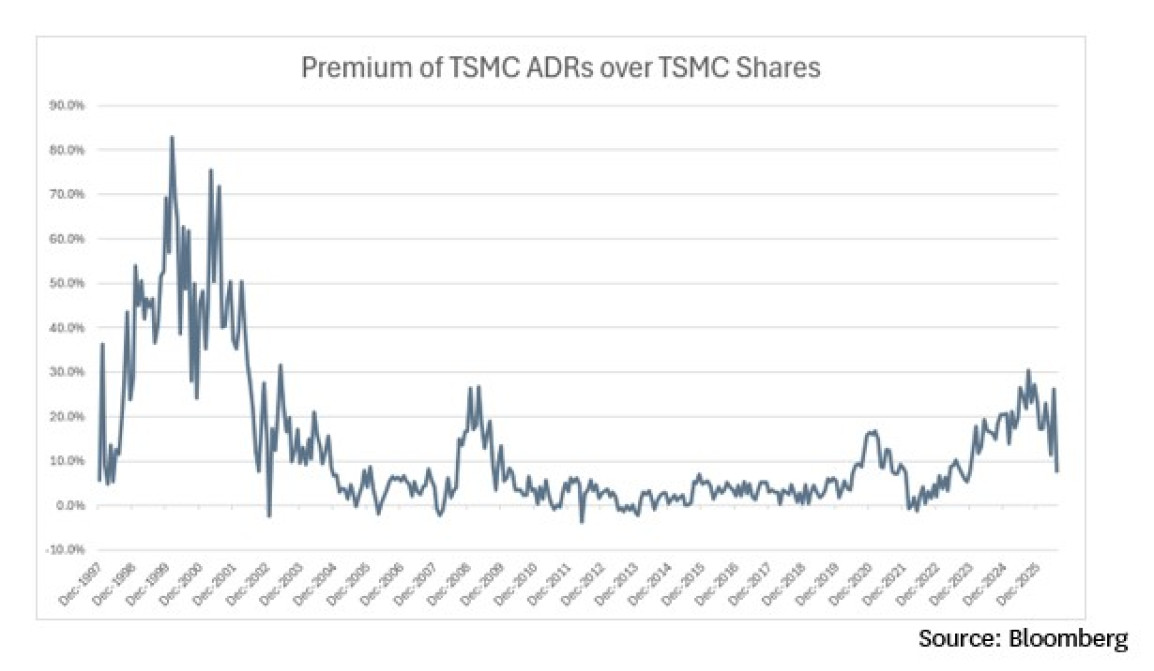
We can see this by looking at the history of ADRs in Taiwan Semiconductor Manufacturing Company (TSMC), which has had ADRs listed in the US and shares listed in Taiwan for almost 29 years. In common with SK Hynix: (1) TSMC’s ADRs are non-fungible; (2) TSMC represents a large proportion of the capitalisation of its local share market; and (3) TSMC is listed in a local market that is subject to investor ID requirements which make it administratively messy for foreign shareholders to buy shares.
As can be seen from the graph below, TSMC ADRs have typically traded at a premium to the local shares, but this premium has typically been relatively small (less than 5%) for most of the past 20 years. Occasionally, however, the premium has got very large, as occurred in September last year, when the ADRs rose to a 30% premium to the ordinary shares. It also rose to a 20% premium in late 2020 and spiked to over 20% a couple of times in 2009. However, spikes in this premium have not lasted for long (at least, not in the past 20 years). Notably, the 30% premium that TSMC ADRs were trading at in September last year has already shrunk to just 11% (last Friday).
There is a likelihood that the retail investors and unsophisticated fund managers who have been piling into the SK Hynix ADRs will face a similar reckoning. I have identified 3 other Korean companies that have limited-fungibility ADRs listed in the United States (SK Telecom, KT Corp, and Korea Electric Power Co) and on average they’re currently trading at a 1.1% discount to the Korean shares. Like SK Hynix, these three ADR programs have quotas on how many Korean shares can be converted to ADRs, but currently only one of these ADRs (KT Corp) is using 100% of that quota.
If SK Hynix ADRs follow the example of these other Korean ADRs and settles down to parity with the Korean shares over the next couple of years, the return that you’d get from investing in the ADRs would be about 13% to 14% per annum worse over the next two years than the return you’d get from investing in the Korean shares.
To my mind it requires a huge degree of confidence in your ability to see to the future to make an investment when you’re handicapped to this extent. Consistent with the Dunning-Kruger effect, I doubt that many of the investors piling into SK Hynix ADRs truly have the foresight to justify the handicap of buying an ADR that will quite possibly underperform the underlying share by more than 10% per annum over the next couple of years.
Dual-Company Structures
The TSMC and SK Hynix ADRs do not represent the only example of investors paying huge premiums to the price they could pay for other securities promising exactly the same dividends over time.
Another example (which was more common in the past, but is now going out of fashion) is the dual-headed company structure, whereby the same underlying business is owned by two different parent companies domiciled in two different countries through a complex joint venture arrangement which mandates that shareholders in the two parent companies each receive identical dividends per share.
The most prominent surviving example of this is Rio Tinto. Rio Tinto Ltd in Australia and Rio Tinto plc in the United Kingdom jointly own Rio Tinto’s operations and pay identical dividends, although Rio Tinto Ltd’s shares come with Australian franking credits, which are valuable for Australian taxpayers, but useless to the rest of us. Rio Tinto’s Australian shares trade at a 20.6% premium to Rio Tinto’s UK shares.
Historically, BHP had a similar structure, and its Australian shares used to trade at a 20% premium to the UK shares before the two BHP entities were merged in 2022, such that BHP shares are now fungible and trade at the same price in the UK and Australia. Similarly, Carnival used to have a dual company structure spread across the UK and US, and Carnival’s US shares traded at about a 10% premium to the UK shares until the two structures were merged earlier this year. Shell, Unilever, and RELX (previously Reed Elsevier) all had dual UK/Netherlands company structures that have been merged in the last decade. Investec still has a dual company structure across the UK and South Africa.
Looking at the recent pattern of dual company structures being collapsed into a single company, it seems like just a matter of time before Rio Tinto gets collapsed into a single entity, which should lead to either a 20% rise in the UK share price of the Rio Tinto plc or a 17% decline in the Australian share price of Rio Tinto Ltd (or some combination of the two).
You would think it would be a no-brainer for NZ funds to avoid the Australian shares and only own the UK shares. But no, seven of New Zealand’s ten largest multi-asset class funds own Australian shares in Rio Tinto Ltd (only six own UK shares in Rio Tinto plc), and in 4 out of these 7 cases, they own more of the Australian shares than they do of the UK shares, even though there are almost 3 times as many of the cheaper UK shares on issue as there are of the more expensive Australian shares.
The reason for this bizarre skew to the more expensive Australian shares is no doubt that the managers of these multi-asset-class funds allocate some money to an Australian portfolio manager (who ends up buying the Australian Rio Tinto Ltd shares because everything else in Australia looks even more expensive) and allocate another bucket of money to a global portfolio manager (who has a bigger universe of equities to choose from).
The underlying problem is that many NZ fund managers continue to make specific allocations to Australian equities even though it is arguably the most expensive equity market on the planet if you compare valuation multiples sector-by-sector. Arguably, the root cause of this over-valuation is the huge pool of money from Australian compulsory superannuation combined with the home-bias of many Australian funds. The disparity between Rio Tinto’s UK share price and its Australian share price is a clear symptom of this issue.
Preference Shares
In Germany and South Korea, there was a historical tendency for companies to issue two classes of shares: ordinary shares (which have a regular entitlement to receive a dividend and vote) and preference shares (which don’t have the right to vote on most matters, but have the right to a slightly higher dividend than the dividends declared for ordinary shareholders). More recently, there has also been a trend towards US companies issuing different classes of shares with different voting rights, and Switzerland and Sweden also have a number of companies that have issued different classes of shares with different voting rights.
In theory, preference shares and ordinary shares with near-identical dividend rights should trade at very similar prices. The right to vote has very little value if you’ve only got a small shareholding and your fellow shareholders are rational. If you pay a higher price for the same stream of future dividends and plan to hold the shares for a very long period of time, the inevitable result is that you’ll get a lower return because the higher price you’ve paid translates into a lower dividend yield.
In Germany, some of these multi-share-class structures have been wound up, with companies simplifying their share registers by offering preference shareholders the choice to swap their preference shares for ordinary shares. For example, in 2013, Fresenius Medical preference shares were trading at about a 20% discount to the ordinary shares when the company offered preference shareholders the right to swap for ordinary shares, resulting in a 25% gain to preference shareholders (including the portfolio I was managing for ACC at the time). In June of this year, BMW made a similar restructuring, replacing preference shares with ordinary shares (15 years ago, the BMW preference shares had traded at a 35% discount to the ordinary shares, although this had narrowed in recent years). Most German preference shares now trade at only modest discounts to the ordinary shares (or even premiums, in the case of Sartorius and Henkel), although Sixt’s preference shares still trade at a 17% discount to the ordinary shares. In Germany, the main pattern is for whichever security is represented in the most share market indices to trade at a premium to equivalent securities that are included in fewer indices.
Meanwhile, in Korea, preference shares continue to trade at far wider discounts than we ever saw in Germany, and no Korean company has yet taken steps to consolidate its ordinary and preference shares. One factor contributing to this discount is the fact that preference shares are excluded from the widely-followed KOSPI index (and in most cases, from MSCI’s ACWI index). In the table below, I give some examples of Korean companies where the preference shares trade at big disc0unts to the ordinary shares: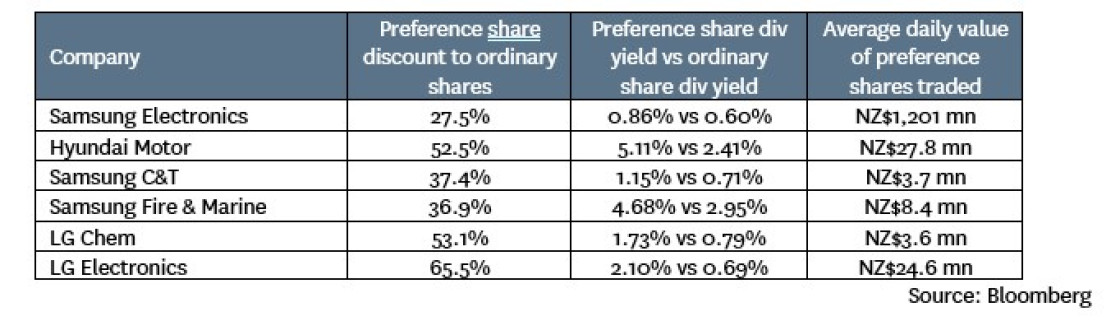
In some cases, these discounts are partly justified by a relative lack of liquidity. However, for any investor who takes a long-term view and isn’t managing a portfolio valued in the tens of billions, these preference shares are generally liquid enough to dispose of a small holding over a few days with minimal market impact. This can be inferred from the rightmost column in the table above, where you can see that the least liquid of these preference shares are still being traded in quantities that are comparable to many top-ten NZ companies.
The higher dividend yields available from investing in Korean preference shares mean that they will produce higher returns than the ordinary shares even if the discounts stay at the current very high levels. And if these discounts narrow up over the next few years, the returns could be quite spectacular. For example, if LG Electronics ordinary shares continue to trade at today’s share price, but the preference shares narrow to a 10% discount over the next 5 years, then LG Electronics preference shareholders would enjoy a 5-year return of 22.6% per annum while LG Electronics ordinary shareholders would only get a 0.7% return over the same period.
Conclusions
When two different securities which pay the same dividends trade at wildly different prices, this is a clear example of market inefficiency. Passive funds do not exploit this inefficiency. Rather, in many cases they contribute to it, by replicating benchmark indices that include the relatively expensive security and exclude the cheaper security.
Active investors and active fund managers should in theory be exploiting these inefficiencies by (for example) favouring SK Hynix shares over SK Hynix ADRs, favouring Rio Tinto’s UK shares over its Australian shares, and favouring relatively cheap preference shares over the ordinary shares in the same company. But in many cases, it seems that investors are so confident in their ability to pick future winners and foresee the future that they turn up their noses to the modest but predictable gains that can be achieved by exploiting these clear market inefficiencies, preferring to make bold bets on whichever company they think will sell the most picks and shovels into the AI gold rush.
In other cases, a propensity for trading may mean that active investors place a much higher weight on maximising liquidity and reducing transaction costs than they do on identifying securities that offer relatively attractive long-term returns. If you know you’re only investing for the short term, this logic makes sense: for example, the 4.4 day average holding period we previously observed for SK Hynix ADRs would be extremely costly to replicate in the Korean shares, as the 0.20% securities transaction tax on sales of Korean equities would represent an annual cost of over 11% of portfolio value to anyone who turned over their portfolio every 4.4 days!
But perhaps the most interesting aspect of these market inefficiencies is what they reveal about investor behaviour and market pricing. Some key observations I’d make are:
- The fact that many securities have traded at premiums in Australia and the United States is a clear sign that the weight of investor money in these markets has been inflating valuations.
- Conversely, the fact that so many shares have traded at lower prices in the United Kingdom than the price of the equivalent securities in other markets indicates a relative lack of demand for UK shares contributing to relatively attractive valuations.
- The relatively lower prices that local investors are prepared to pay for TSMC in Taiwan and SK Hynix in Korea probably reflects (1) under-ownership of the Taiwanese and Korean markets by offshore investors; and (2) local investors trying to diversify away from the dominance of TSMC in the Taiwanese market and the two memory chip makers (SK Hynix and Samsung Electronics) in South Korea (which means that they prefer that these companies represent a smaller proportion of their domestic equity portfolios than is implied by market capitalisation).
- The relative under-ownership of Taiwanese and South Korean equities is partly due to the administrative hoops that foreign investors have to jump through. In Korea’s case, the under-ownership by foreign investors is also due to the fact that passive funds investing in developed equity markets are often benchmarked against the MSCI World index (which treats South Korea as an emerging market) while many Emerging Market Funds are often benchmarked against the FTSE Emerging Markets index or the S&P Emerging markets index (which both treat South Korea as a developed market). As a result, many investors in passive funds have inadvertently chosen to not invest in what has been the world’s best performing share market over the past year!
- The differential pricing between preference shares and ordinary shares in the same company reflects: (1) the huge impact that index inclusion often has on market pricing; and (2) the extent to which short-term-orientated share market participants emphasise liquidity over valuation.
Nicholas Bagnall is Chief Investment Officer at Te Ahumairangi Investment Management.
Disclaimer: This article is for informational purposes only and is not, nor should be construed as, investment advice for any person. The writer is a director and shareholder of Te Ahumairangi Investment Management Limited and an investor in Te Ahumairangi Global Equity Fund. Te Ahumairangi manages client portfolios (including Te Ahumairangi Global Equity Fund) that invest in global equity markets, and hold shares in the following securities mentioned in this column: Taiwan Semiconductor Manufacturing Company (Taiwanese-listed shares); Rio Tinto plc (UK shares); BHP; Fresenius Medical; Henkel (preference and ordinary shares); Samsung Electronics preference shares; Samsung C&T (preference and ordinary shares); Samsung Fire & Marine (preference and ordinary shares); LG Chem preference shares; and LG Electronics preference shares.