When the tide goes out…
NBR Articles, published 24 May 2022
This article, by Te Ahumairangi Chief Investment Officer Nicholas Bagnall, originally appeared in the NBR on 24 May 2022.
When the tide goes out, you get to see who's been swimming naked.
This adage is rarely as apt as it is for the world of funds management, where it often takes a sustained market decline to reveal which fund managers had been taking an above-average level of risk.
Risks in an equity portfolio are typically two-sided, such that a portfolio that is intrinsically likely to fall harder than the market during a market downturn would also tend to rise faster than the market when the equity market is rising.
Bull markets can make risk look like skill
The two-side aspect of market risk can make it challenging to simply use the pattern of returns to work out how risky an equity portfolio is if the market has been steadily moving in one direction. After an extended period of market strength, it can be difficult for outside investors to work out whether the fund managers posting the best returns are getting their good results due to true value-add (a.k.a. "alpha" in finance circles) or whether the good results are simply the consequence of greater-than-normal sensitivity to market conditions (a.k.a. "high beta").
Unfortunately, less sophisticated investors often tend to assume they're seeing "skill" when they're really seeing "risk". Unable to tell the difference, retail investors often end up investing most of their savings with those fund managers that have achieved the best returns over an extended bull market.
In reality, the dominant factor determining where different fund managers sit on a table of historic returns over periods of 2 to 3 years is the average risk profile of their respective funds. This risk profile encompasses each fund's sensitivity to general market conditions, as well as its skew to other "factors" such as the relative performance of growth versus value stocks. Because unsophisticated investors tend to select the best performing funds, by the end of an extended bull market, they tend to end up heavily weighted in funds that have an unusually high sensitivity to market risk.
After the market dives, it becomes far easier to discern "skill" from "risk", as fund managers whose returns can be explained by superior skill would be expected to continue out-performing in the down-market, whereas fund managers whose good performance in an up-market was mainly due to a high exposure to market risk will tend to under-perform when the market declines.
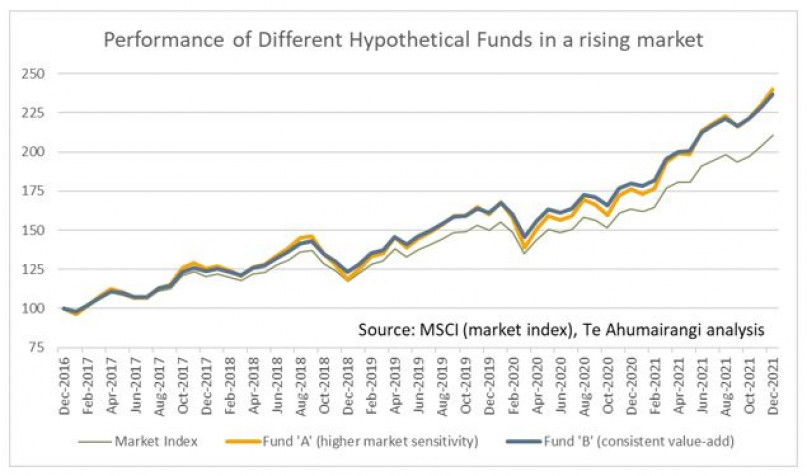
In the graph below, I show cumulative returns from two hypothetical funds over a period of market strength. For the purposes of this graph, I assume that Fund “A” is simply taking a greater than average level of market risk but is not really adding any value. When the market return beats the cash return, I assume this fund’s pre-fee return will beat cash by 30% more than the market does, but when the market return underperforms cash, I assume that Fund A’s pre-fee return will also underperform cash by 30% more than the market’s underperformance against cash. On the other hand, I assume that Fund “B” is a true value-adder, beating the market by 0.1% (on a net-of-fees basis) every single month. As you can see from the similarity of the two lines on this graph, in an environment of rising equity prices, it can be difficult to distinguish “risk” from “skill”.
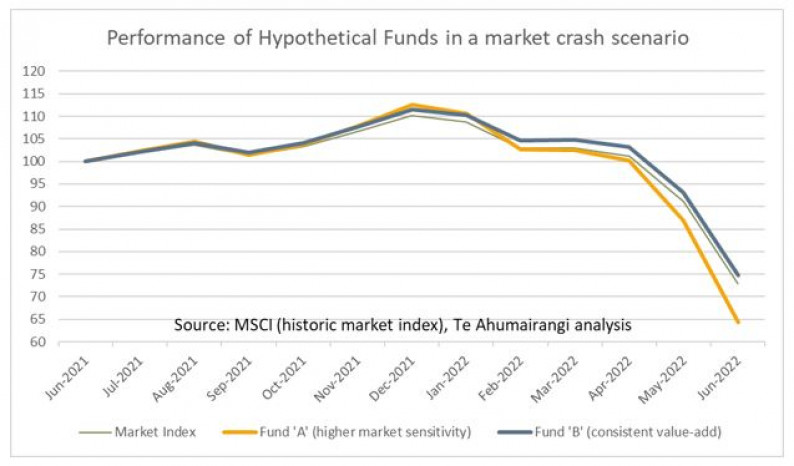
For the next graph, I look what would happen to these two funds in a scenario where the market crashes, declining another 25% from where it is today. As should be clear from this graph, a market decline (and particularly a market crash) would make it clear which of these funds was truly adding value, and which one was just taking on more risk. The falling tide is showing who has been swimming naked.
Looking at some of the biggest global equity offerings available to retail investors in the New Zealand market, it already seems clear that some global equity funds that previously delivered good returns were achieving this mainly through higher-than-normal risk. At least three of the largest global equity funds open to retail investors have lost more than 19% of their value in the first 4 ½ months of this year (I used data up to 18 May). This is a significant underperformance in comparison to broad market indices – these indices have "only" lost between -12% to -13% in gross terms if you assume 50% hedging to NZ dollars, or -10% without hedging.
Each of the underperforming funds has previously reported a risk rating of "5", which implies a standard deviation of returns of less than 15%. If the standard deviation of returns from these funds was truly less than 15%, the probability of seeing returns this bad over a 4 ½ month period should be about one-in-a-thousand.
Unfortunately, a greater-than-average exposure to market risk is not that uncommon amongst active fund managers. When I was at the ACC, we would use multi-factor regressions of fund manager returns to narrow down the options out of hundreds of fund managers around the world, and we would typically find that the majority of them were taking more market risk than their benchmarks.
However, many fund managers are not that far away from the benchmark when it comes to overall sensitivity to market conditions, and we can see this in the fact many other global equity funds offered to New Zealand retail investors have achieved returns so far this year in a range of -15% to -8%, roughly in line with equity markets. At least one small fund with an emphasis on lower risk investing has managed to roughly hold its value so far this year despite the decline in equity markets.
The growth explanation
A different perspective on the underperforming funds is that they were all run by "growth-orientated" fund managers, and growth stocks have significantly under-performed value stocks so far this year. Perhaps their returns this year would be better compared to an index such as the MSCI World Growth index, which has underperformed the MSCI World index by -9.5% so far this year. This is a valid point, but if investors excuse the performance of their fund manager in the current year by comparing their fund’s performance to an index of growth stocks, they should also recast their analysis over earlier years, and use the MSCI World Growth index to re-evaluate whether those same funds had been underperforming in prior years.
The massive underperformance of growth stocks during the decline in equity markets this year might seem to support a conclusion that growth investing is significantly more risky than value investing. However, this observation is more specific to the current environment (as well as the market environment during and after the late-1990s “TMT” boom) than a general case. If you look at the MSCI growth and value indices over long periods of time, one would conclude that on average over time, growth stocks have only been slightly more risky than value stocks. Since 1974, the standard deviation of returns from the MSCI World Growth index has been 15.5%, compared to 14.7% for the MSCI world Value index.
The risk associated with any investment style will vary with the market environment. Growth stocks were relatively low risk investments in the mid-2000s when investors had sworn off growth investing to such an extent that you could invest in some of the highest quality companies in the world on P/E multiples that that were only 2 or 3 points higher than the lowest quality companies. But as the price that investors have had to pay for future growth prospects has got higher and higher over the 15 years through to the end of last year, the risks associated with growth investing had also increased.
A common characteristic of market peaks is that the high valuation of the entire market is linked to some particular conceit or blind spot that makes investors willing to pay exceptionally high prices for a particular investment characteristic. The 1990s tech boom and the growth/tech boom that peaked last year were both associated with investor willingness to pay exceptionally high prices for the promise of future growth, but other market peaks have been associated with different conceits. For example, the market environment that preceded the GFC was linked with a belief in the sustainability of business models which saw both companies and individuals obtain cashflow by borrowing ever-increasing amounts against rising asset values, and New Zealand’s share-market boom of the mid-1980s was tied to an apparent belief that the managers of investment companies and property developers would achieve exceptional returns on the additional funds that they kept on raising through the issuance of more and more equity. The lesson from history is than when the market’s been strong for several years, investors should be wary of whichever investment characteristics have been most in vogue while the market has been rising.
Disclaimer: This article is for informational purposes only and is not, nor should be construed as, investment advice for any person. The writer is a director and shareholder of Te Ahumairangi Investment Management Limited, and an investor in the Te Ahumairangi Global Equity Fund. Te Ahumairangi manages client portfolios (including the Te Ahumairangi Global Equity Fund) that invest in global equity markets.