Why do passive global equity funds fall so far short of market returns?
NBR Articles, published 23 September 2025
This article, by Te Ahumairangi Chief Investment Officer Nicholas Bagnall,
originally appeared in the NBR on 23 September 2025.
As all investors should know, the majority of active fund managers underperform their benchmarks over extended periods of time. This has been well documented in Standard & Poors’ SPIVA survey, which shows that in most asset classes around the world, the majority of active fund managers have underperformed the market.
As the table below shows, this has certainly been the case with the actively managed global equity funds that are available for New Zealand investors. Over the 3.75 years since we launched our global equity fund in November 2021, the MSCI World Index has returned +67.0% in NZ dollar terms and the MSCI All Countries index has returned +63.1%, yet most actively managed global equity funds available to New Zealand investors have done much worse than this.
In the table below we show how some of the largest actively managed Global Equity Funds available in New Zealand have performed over this 3.75 year time period. As can be seen, 6 of the 7 funds have performed worse than the MSCI World index (even if you adjust the numbers to take account of their different hedging approaches) and 5 out of 7 have underperformed the MSCI All Countries index.
I have anonymised the funds, because the point of this article is not to pick on the poor performance of any single active fund. Instead, I want to use this column to point the spotlight at a less-frequently-luminated topic, the performance of passive funds. But before I do this, I use the table below to acknowledge that the performance of actively managed global equity funds domiciled in New Zealand is at least as bad as their peers in other parts of the world.
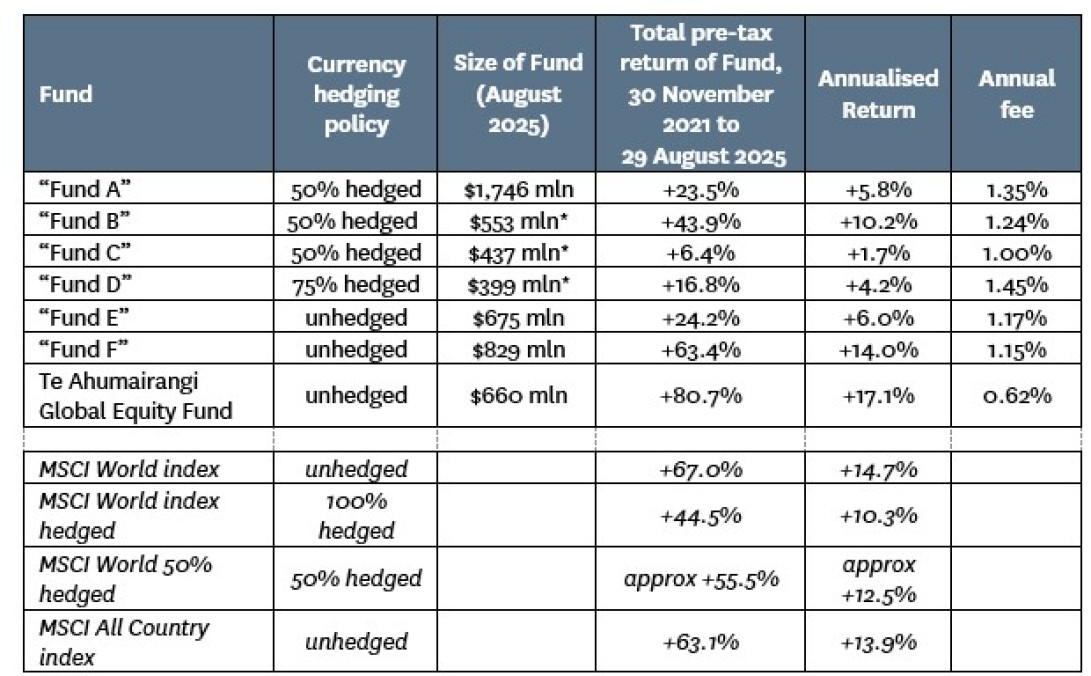
Source: Disclose Register filings, Fund fact sheets, Investment Manager websites, MSCI, Bloomberg. Asterisked (*) fund sizes are as at 30 June 2025 (as no fund size disclosed for August 2025).
Gross Indices vs Net Indices
At the bottom of the table above, I have provided data on the returns of various MSCI indices, to provide a common basis for comparison. To be clear, many of the funds use slightly different benchmarks.
However, comparing the funds against the benchmark returns that they have published is in many cases a soft comparison, because a lot of New Zealand fund managers like to compare their pre-tax fund returns to net return indices. Net return indices are calculated after deducting generous* allowances for the withholding taxes that could be paid on the dividends received by the fund.
Using net return indices is a completely inappropriate benchmark for the pre-tax returns achieved by global equity funds. (It also appears to be illegal, as the Financial Market Conduct Regulations 2014 say that funds must report the market index return before any deductions for tax.) I show data for the MSCI gross return indices as I think it is important that pre-tax returns be compared to a pre-tax benchmark.
* Note: I say “generous” because net return indices essentially look at the tax that would be paid by an investor domiciled in a country that has no tax treaties with any other country. As New Zealand has tax treaties in place with most significant economies around the world, NZ residents pay lower rates of withholding tax than index providers assume when they calculate these net return indices. (So net return indices would still be an easy benchmark even if managers used them as a comparison for their returns net of foreign taxes).
Does poor performance of active funds support investment in passive funds?
On the basis of how poorly many actively managed global equity funds have performed, it easy to understand why many investors decide to avoid active management and instead invest in passive funds.
In choosing “passive”, many investors believe that they will be getting the market return. For the remainder of this article, we are going to focus on whether this is in fact the case, and if not, why not?
In the table below, I show the performance of some of New Zealand’s largest passive global funds over the year to August 2025, as well as the 3.75 year period shown in the previous table. The only reason for showing the one year return (rather a longer time period) is that many of the largest passive funds in New Zealand only have a very short performance history (i.e. they’ve been in existence for less than 3.75 years).
All of the fund returns shown below are from unhedged global equity funds. I have only included truly global funds, and have therefore excluded funds that only invest in one region or one sector.
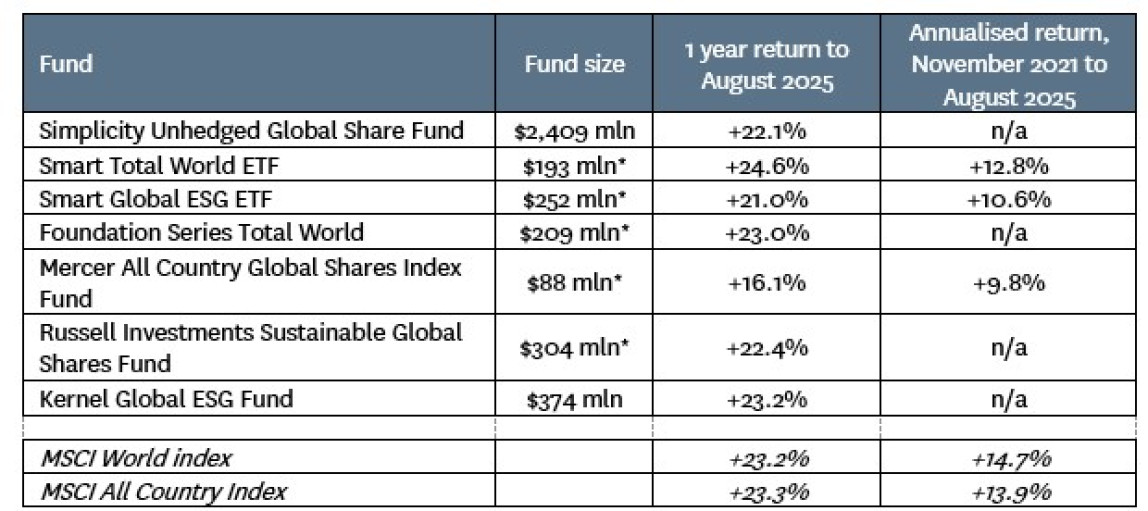
Source: Disclose Register filings, Fund fact sheets, investment manager websites, MSCI, Bloomberg. Asterisked (*) fund sizes are as at 30 June 2025 (as no fund size disclosed for August 2025).
As can be seen, not a single one of these passive funds has achieved a return that was within 1% of the MSCI All Country index over the past 3.75 years.
In common with the actively-managed funds, many passive funds like to compare their pre-tax returns to net return indices (which are calculated after making a deduction for foreign withholding taxes). This comparison can be particularly effective at camouflaging poor relative performance by passive funds, as passive funds underperformance is likely to be in small amounts, rather than large underperformances that are possible for active managers making big bold stock calls.
Why do passive funds underperform by so much?
Clearly, many passive funds have significantly lagged the relevant global indices. Why is this?
I have personally been surprised by the magnitude of some of the underperformances, as (from an active manager’s perspective) replicating a benchmark return seems like a pretty simple exercise.
I’ve therefore tried to look into why so many of these funds are underperforming. I think I’ve found some of the answers, but am not sure that these answers can explain the full extent of some of the underperformances:
Fees
Most obviously, passive funds charge management fees, and although these fees are generally lower than the fees on actively managed funds, they still eat into the funds’ returns. Most passive funds charge fees of no more than 0.3%, but the “Smart” funds take a bigger clip than this, with fees of 0.40% per annum on the Smart Total World ETF and 0.54% on the Smart Global ESG ETF.
Transaction & Custody Costs
Passive funds have to buy and sell equities and undertake foreign exchange transactions not just when their benchmark index changes, but also whenever investors buy new units or redeem existing units in the fund. Some passive funds do not charge buy/sell spreads to investors putting in new money or withdrawing monies from the fund, which means that the cost of accommodating these flows in and out of the fund is borne by all investors in the fund, not just those that are generating the transaction.
While commission rates are generally charged as a percentage of transaction value, custodians charge for the administration of matching trades on a dollars per transaction basis. This can be significant for passive funds, because they will tend to spread their buying and selling thinly over many securities. For example, an active fund manager receiving an inflow of $1 million of new money into their fund might choose about dozen stocks to buy with the new funds, which may result in slightly over $100 of additional custody cost. By contrast, a passive fund manager receiving a $1 million inflow is likely to spread it across about 1,500 stocks, which would likely result in over $1,000 of additional custody cost.
Further, most active investment managers (including Te Ahumairangi) charge an all-inclusive management fee, with costs such as custody charges deducted out of their fee entitlement before it is paid to the investment manager. By contrast, some passive funds (such as the Mercer and Russell funds) seem to operate on a “management fees plus” basis, whereby the fund manager is paid a certain percentage of funds under management regardless of the size of the in-fund costs. In such cases, custody costs are incurred as a separate cost to the fund. As an indication of how expensive they can be, the Mercer All Country Global Index Fund incurred $79,000 of custody costs in the last financial year, on a fund size that only averaged about $79 million. Hence, custody costs took 0.10% out of the return of the fund.
Tax Inefficiency
Some funds avoid the “messiness” and custody costs of having to directly own a lot of stocks by just holding units in an offshore fund that holds the underlying shares. For example, the Smart Total World ETF only holds units in the (US-based) Vanguard World ETF, which in turn owns about 10,000 different securities. Similarly, the Smart Global ESG ETF invests in the “iShares MSCI World ex Australia ESG” ETF which is incorporated in Australian and managed by BlackRock.
While this helps to reduce the custody costs directly incurred by the fund, it does lead to a tax inefficiency, as the iShares MSCI World ex Australia ESG ETF will be paying withholding taxes on the dividends that it receives from companies outside of Australia, but cannot pass on any tax credit from these dividends that would be recognised by the NZ IRD. Accordingly, NZ investors in this fund are receiving a return that has already had tax deducted on dividends paid from abroad into an Australian entity, but are then having to pay full PIE tax (with no tax credits) on their investment.
By contrast, when NZ PIE funds directly own shares in offshore companies, any withholding taxes deducted from the dividends that the PIE fund receives will generally be available as a tax credit against the PIE tax payable by investor in the fund.
ESG Exclusions?
Four of the funds in the table above operate under ESG exclusions. This means that the shares that they hold are not fully representative of the broader global investment universe. For example, the Simplicity fund is managed against a benchmark which seems to exclude Berkshire Hathaway, Walmart, General Electric, and Exxon Mobil.
Such exclusions could in theory lead to either better or worse performance than you would get with a more representative index (similar to what you see with an active fund manager). It is not clear whether ESG exclusions have added or subtracted to the performance of the funds shown in the table above.
Costs & inconveniences missing from the benchmark indices
Benchmark indices make a number of simplifying assumptions that can lead to a slight overstatement of the returns that would be possible from passive investment. These include:
- Ignoring stamp duties and financial transaction taxes. In some countries, including Ireland (1%), the UK (0.5%), and France (0.4%), the governments impose a significant tax on the purchase of equities. While passive investors can negotiate down broker commissions to almost zero, this is not possible with government taxes.
- The gap between dividend “ex” date and dividend payment date. The reality with some markets can be that investors don’t receive dividends until as much as four months after the entitlement to the dividend accrued to shareholders. Index providers ignore this, and assume that dividends are available to spend as soon as a stock has traded “ex dividend”.
- Foreign exchange spreads in emerging markets. While it is generally possible to trade liquid currencies on foreign exchange spreads of less than 0.01%, this is not always possible for emerging markets, where local rules sometimes mean that investors have no choice but to deal at whatever price their custodian bank will show them.
None of these factors is huge, but collectively they could detract a few basis points from the return of a passive fund.
Implementation?
In theory, passive funds are supposed to buy stocks when they are added to a benchmark index and sell them when they’re demoted out of the index. However, studies on the subsequent performance of index additions and index deletions have shown that buying on the day when a stock goes into a commonly-followed benchmark or selling on the day that it gets deleted from the benchmark is about the worst possible timing, with index additions typically under-performing for several months after they are added to a commonly-followed benchmark, whereas deleted stocks typically rebound and produce good returns in the months following their demotion from an index.
Hence, we might expect that an intelligent (but not- overly-shackled) manager of a passive fund would be able to add a little bit of value in implementation, by partially delaying the implementation of changes to their fund in response to changes in the benchmark. However, neither the performance of the funds nor their investor materials suggest that they try to improve performance in this way.
Our experience as an active manager is that it’s not too difficult to add modest amounts of value in implementation if you’re picky about the prices at which you’re prepared to deal. By being discriminating on price, we find that on average we deal at slightly better than closing prices, and on average we buy stocks that outperform and sell stocks that underperform over the days following or transaction.
However, this mindset is difficult to reconcile with the ethos of passive management, which is essentially a worldview that markets are efficient and it therefore doesn’t matter what price you end up buying or selling a share.
But even with this mindset, it is difficult to see why passive funds should subtract value through implementation, as they are essentially benchmarked against closing prices, and in pretty much every developed market it is possible to place a “close order” which is guaranteed to execute at the closing price (regardless of how silly that might be).
In conclusion, many actively managed global equity funds have produced appalling returns, but passive funds have hardly been a “get out of jail free” card, as many of the passive funds have also underperformed global equity markets by a significantly greater margin than you would expect on the basis of their stated fees. I offer some suggestions as to why this may be the case, but I don’t think that I can fully explain the extent of some of the underperformances.
Nicholas Bagnall is Chief Investment Officer of Te Ahumairangi Investment Management
Disclaimer: This article is for informational purposes only and is not, nor should be construed as, investment advice for any person. The writer is a director and shareholder of Te Ahumairangi Investment Management Limited, and an investor in Te Ahumairangi Global Equity Fund. Te Ahumairangi manages client portfolios (including Te Ahumairangi Global Equity Fund) that invest in global equity markets.
A table in this column shows historical returns from Te Ahumairangi Global Equity Fund. Readers should be aware that past performance is not a reliable indicator of future performance, and should read the Product Disclosure Statement before investing.