Are We In An AI Capex Bubble?
NBR Articles, published 6 May 2025
This article, by Te Ahumairangi Senior Analyst Ian Graham,
originally appeared in the NBR on 6 May 2025.
The money being spent on AI-related capital expenditures is enormous. Microsoft, Google, Meta and Amazon are guiding for combined capex in 2025 of >US$300bn, much of which they’ve said is going toward AI infrastructure. The Stargate Project has earmarked US$500bn over the coming five years along with speculation that xAI is planning the first 1m GPU cluster at a cost of US$150bn-US$200bn.
Taken together, it seems reasonable to assume that American companies will spend more than US$1tr on AI infrastructure over the next five years. That works out to around 3.5% of current U.S. GDP (approx. US$29 trillion) in total, or about 0.7% pa if it’s spread evenly. That’s a big number, and it naturally leads to some important questions. Are we in a capex bubble—and, by extension, an earnings bubble for the suppliers of this infrastructure? How will the builders monetize the investment? And perhaps most importantly for us as investors: can we participate without taking excessive risk and becoming a casualty in a potential boom-bust cycle?
All capital expenditure is inherently cyclical, meaning that companies supplying capital equipment often face above-average risk. This cyclicality is most pronounced when demand stems from new build projects, especially where early investment risks obsolescence. It is less extreme when driven by replacement needs. Over time, many replacement-driven capex cycles display predictable patterns, allowing future peaks to be estimated from historical trends. However, such forecasting is not possible for emerging technologies like AI infrastructure, where no prior demand cycles exist for reference.
As of now, roughly 17% of the MSCI World Index is tied up in names with material exposure to AI infrastructure—either as buyers and builders (like Microsoft, Meta, Google and Amazon) or as suppliers (like Nvidia and Broadcom). So having a well-formed view on this is critical when it comes to modelling and valuing large segments of the global equity market.
To understand it properly, I think it's useful to separate the roles in this ecosystem. On the one hand, we have the infrastructure suppliers—the “picks and shovels” of the AI gold rush. On the other hand, we have the infrastructure owners and operators, the ones building and operating the platforms and selling the product or service to the consumer. In today’s context, Nvidia is clearly the dominant supplier (with Broadcom emerging), while Microsoft, Google, and Meta are the major buyers and builders.
A Historical Perspective
To assess whether this is a bubble, it’s helpful to look at historical precedent. Are we truly in uncharted waters, or are there other periods we can compare this to?
There's a cognitive bias called "presentism"—the tendency to view the current moment as uniquely significant, while underestimating how transformative previous eras have been. And yes, while the pace of AI innovation and the scale of spend seem huge, there are several moments in history that can offer perspective.
I think there are six periods of foundational infrastructure spending (i.e. infrastructure that fundamentally reshaped daily life, work, and economic systems) worth mentioning.
From what I’ve read, the largest single capex wave in a new technology (relative to GDP) was the U.S. railroad expansion. In the 1850s, rail capex averaged about 1.7% of GDP pa, peaking at 2.6% in 1854. To match that today, given current U.S. GDP of US$29 trillion, AI-related spend would need to hit US$500bn pa, with peak years approaching US$770bn. That’s significantly more than what we’re seeing so far. One additional estimate frames this scale even more starkly: the two British and American “railway manias” of the 1840s and 1860s involved capital investments equivalent to 15–20% of GDP—roughly US$3 to US$4 trillion in today’s dollars[1]. That kind of scale feels almost unimaginable today, even with the AI frenzy in full swing.
Electrification in the 1920s also saw sizable investment. The commercial electric utility sector had bonded debt of US$2.25bn in 1922[2], which was around 3% of GDP at the time. And when you account for power plant construction, transmission line development, and wiring up entire cities and industries, you’re likely looking at an average investment of 0.5% to 1.0% of GDP pa throughout the decade. The highway buildout in the 1950s and 1960s tells a similar story. Highway spending during the 1960s was roughly US$5bn–US$6bn pa, at a time when GDP was around US$720bn—again, putting that investment in the 0.5% to 1.0% of GDP range.
Those two periods suggest to me that, on a relative basis, current AI infrastructure investment (at ~0.7% of GDP annually) is approaching the mid-point of past transformational buildouts but hasn’t yet gone past them. Compared to today’s US GDP, 0.5% to 1.0% would require annual expenditure of 145bn to 290bn pa on AI infrastructure.
Then there’s IBM’s mainframe era. Unfortunately, it’s tricky to get a strong steer from IBM due to the differences in business models – i.e. IBM revenue primarily came from leasing its mainframes computers, rather than outright sales (like Nvidia). Also, approx. 50% of Nvidia’s revenue was outside the USA in 2025 vs one-third for IBM. With that as a caveat, a June 2024 paper by Empirical Research Partners noted that IBM’s revenue accounted for 17% of total capex among U.S. large-cap companies in 1969. In 2024, Nvidia’s data centre segment generated US$115bn in revenue, which was about 12.5% of the US$913bn in capex across the MSCI USA Large Cap Index. Forecasts have Nvidia’s revenue reaching US$235bn in two years. If we grow the current capex base by 3% annually, Nvidia could make up 24% of large-cap capex by 2027—well ahead of IBM’s historical benchmark (although IBM’s revenue would have been higher if its business model was outright sales vs leasing).
Finally, in some ways, I find the AI buildout similar to periods like the Manhattan Project or the space race—periods where geopolitical urgency drove a “build it at any cost” mindset to ensure supremacy in a new technology for national security reasons. Today’s AI race has similar overtones.
Closer Look: The Internet and Cloud Eras
I think the most useful comparisons come from these two more recent periods, where I have access to better data and the structure of the investment is more similar to today.
In the early ’90s, the commercialization of the internet triggered a frenzy of activity. U.S. telcos like AT&T and Sprint, along with aggressive new entrants like WorldCom and Qwest, raced to lay fibre optic cable and build switching networks. Capital markets were more than willing to fund it – debt was cheap, and equity was practically being thrown at anything with “.com” in the name.
This period has perhaps the strongest similarities to the current AI boom with both fueled by a technological breakthrough and plenty of hype and speculation about its ultimate usefulness – i.e. there are still many pundits who see the prospects for AI as over-hyped, just as many pundits thought that the internet was going to be a flash in the pan (see this 1995 Newsweek headline). In both cases, companies fear missing out: 1990s telecom firms raced to stake their claim in the new internet economy, similar to how today’s tech giants are racing to build AI capabilities and platforms.
 Investment in telecom capex peaked at US$114bn in 2000, equivalent to over US$200bn in today’s dollars. With U.S. GDP at US$10 trillion at the time, telecom spending hit about 1.1%–1.2% of GDP—significantly higher than current AI capex. But it quickly turned out that much of this spend was speculative overbuild. A glut of unused “dark fibre” sat idle for years. By 2002, telecom capex had fallen by two-thirds, and many players went bust—WorldCom, Global Crossing, 360networks, and others. The total value destruction ran into the trillions.
There are obvious similarities with AI today. Companies are building massive compute clusters in anticipation of demand that hasn't yet fully materialized. Google and Meta are spending tens of billions betting that future AI applications will justify the capacity. That’s risky. And yet, there are important differences. The telecom/internet build-out involved many players, including highly leveraged startups that collapsed when the bubble burst. By contrast, most AI capex today is from well-established, cash-rich companies. Google, Microsoft, Meta, and Amazon are funding capex from operating cash flow generated by extremely profitable core businesses, not junk debt. They’re not going to vanish in a downturn.
However, there is also a key difference in the nature of the infrastructure itself which raises a Red Flag. Unused fibre optic cable can just sit in the ground until demand catches up. Unused GPUs, on the other hand, age quickly. Hardware obsolescence is a much bigger issue. If the investment cycle overshoots demand, some of this gear becomes useless.
In terms of the Cloud, the 2010s saw the rise of hyperscale cloud computing infrastructure which allowed customers to outsource their data compute and storage requirements. Amazon Web Services (AWS), Azure (Microsoft), AliBaba and Google Cloud were the main investors, joined by data centre REITs and, to a lesser degree, players like IBM and Oracle.
The big three US-based cloud providers and Meta were spending around US$115bn pa on cloud-specific infrastructure by the end of last decade. Combined with smaller players, total industry capex likely reached US$120–130bn by 2020—about 0.6% of that year’s GDP. That’s slightly below where we are today with AI.
In my opinion, this period offers an example of a more measured expansion effort. Capex scaled steadily with usage over the 2010’s in a mostly cyclically, but growing, trajectory rather than a one-time spike followed by a crash. Supply was also heavily concentrated in a handful of companies, so capacity was tightly controlled (again helping to avoid a boom-bust cycle). No one went overboard. There hasn’t been a crash in public cloud capex – just a sustained shift in the outsourcing of enterprise-level compute and storage, with the main public cloud providers seeming to build out at a rate that matched demand, rather than speculatively building ahead of untested demand. That might well be the most optimistic outcome for AI infrastructure too. Indeed, Microsoft said in its quarterly result last week that its capacity remains constrained with demand trending higher than expected.
So, What Can We Conclude?
The U.S. economy has a long history of spending vast amounts on foundational technologies. The railway and internet booms suggest AI expenditure could still go much higher while other examples suggest we will be getting close to the top of historic ranges by 2026/2027.
The 1990s internet bubble shows us what happens when enthusiasm gets ahead of utility. In contrast, the 2010s cloud buildout shows how things can go right with measured deployment and clear monetization paths.
Whether AI follows the path of railroads, telecoms, or the cloud will depend on two things: how fast real-world use cases emerge, and how effectively companies can turn that usage into sustainable revenue.
Context with Cisco
Cisco was the Nvidia of the 1990s. If Nvidia’s GPUs are today’s pick & shovel for AI, then Cisco’s routers and switches played that role during the internet buildout. Between 1994 and 2001, Cisco’s revenue grew from US$1.2bn to US$22.3 bn — an 18-fold increase in seven years. Nvidia has followed an even more explosive growth trajectory with its data centre revenue expected to grow from US$3bn in FY2020 to US$234bn by FY2027 — a nearly 78-fold increase in seven years.
But what really sets Nvidia apart is its scale and profitability. Cisco’s margins declined right through this period of revenue growth, from 39% in the mid-1990s to breakeven by 2001. Nvidia’s margins, however, are in a difference stratosphere at above 60%, and are projected to remain there. Even more striking is Nvidia’s projected revenue as a share of GDP which is expected to hit 0.73% by FY2027, compared to Cisco’s peak of 0.21%. That’s not just a high level of capex investment in AI — it’s a historically unprecedented concentration of revenue in a single hardware technology firm.
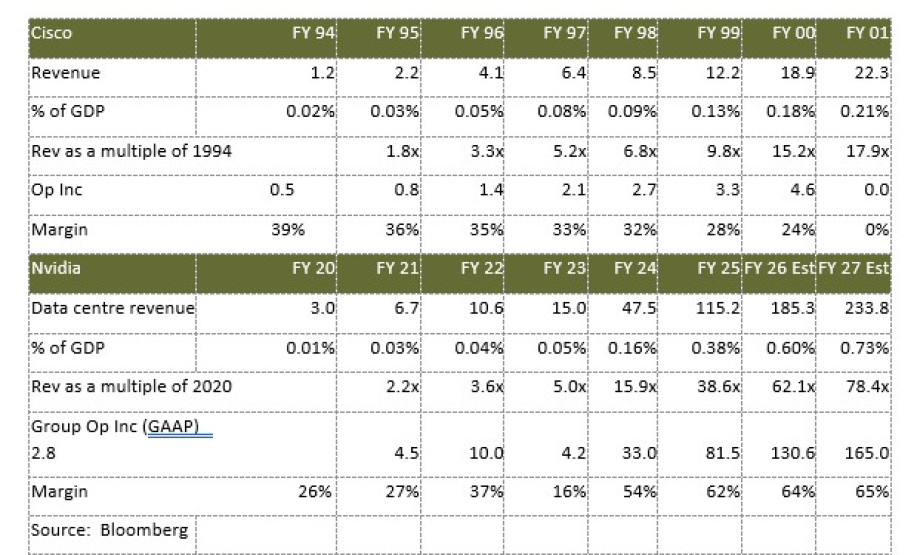
Note: I selected dates that reflect, in my opinion, some critical mass and substance in revenue. For Cisco I picked 1994 when it had 1.24bn of revenue (which, adjusted for inflation would be worth around 2.2bn in 2020 dollars, an amount not to dissimilar to Nivida’s data center revenue in 2019 / 2020 of approx. 3bn).
Cisco’s share price trajectory offers another important lesson. Investors needed to be in the stock years before its 2001 revenue peak to avoid the boom-bust trainwreck. An investor in early 1998 (by my calculation, April 1998 at the latest) would have survived (i.e. their investment would have been worth roughly the same after the dust settled in September 2002); but late investors would have suffered badly. Most companies in Cisco’s orbit didn’t survive the crash — Nortel went bankrupt, Lucent merged with Alcatel and then Nokia, and many others were acquired at deep discounts.
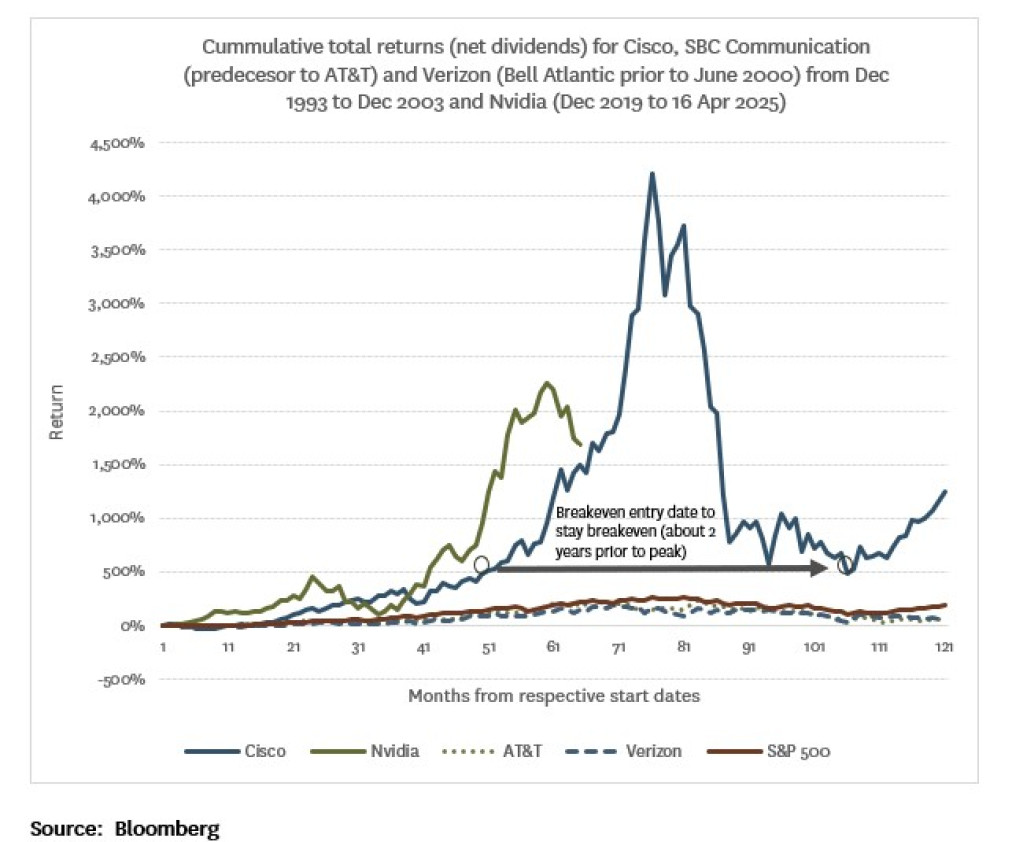
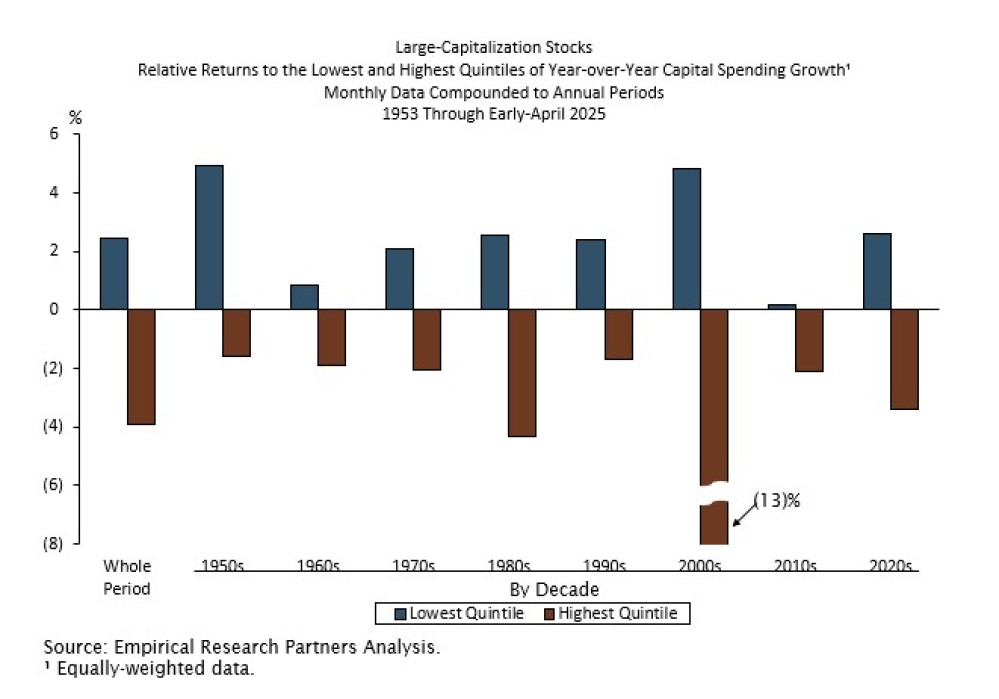
The historical pattern is clear: infrastructure suppliers tend to generate supernormal profits (and share price returns) early in the cycle, but face margin pressure as the buildout winds down and competition intensifies. Meanwhile, the infrastructure owners — the Googles, Metas, and Amazons — typically monetize later and may avoid the sharp boom-bust seen among suppliers. However, this capex burden can put a heavy lid on profitability and share price performance. A long-term study by Empirical Research Partners’ supports this. Companies in the highest quintile of year-over-year capex growth have underperformed the broader market by 2–4% pa, with a notable 13% underperformance during the 2000s. This is apparent in the chart above, with cumulative total returns of 73% and 74% for SBC Communication (now AT&T) and Verizon (was Bell Atlantic until June 2000) respectively over this 10-year period – less than half the return of the S&P 500 (cumulative return of 185%).
The sustainability of this capex cycle with depend on AI’s utility and the path to monetisation
None of this capex makes sense unless we get meaningful utility from AI. While I am optimistic about AI’s potential, the path to monetization remains unclear. If US$250bn has already been spent and another US$1 trillion is coming, these assets will eventually need to generate 15% annual returns — or about US$187.5bn in net income. Assuming a 21% tax rate and 30% operating margins, that implies the infrastructure must support US$950bn in annual revenue — equivalent to around 1% of global GDP (or 1.5% of developed-market GDP).
That’s a big ask. For context, the top five oil majors generated US$1.2 trillion in combined revenue last year, while Google, Meta, and Microsoft together produced about US$760bn. Monetizing AI at this level would require a major reallocation of economic spending, which most AI optimists argue will come from massive productivity gains elsewhere.
My view is that the consumer monetization model will follow social media’s playbook: start off with light monetisation and freemium models, build habit (addiction!), then monetize hard when users can’t live without it. It’s a similar playbook to what Netflix used — operating near breakeven from 2006 to 2016, then improving margins once society became habitual users.
While there are numerous examples of companies that waited years before scaling monetization (e.g. Meta is probably the best-case study), the revenue that AI asset owners need to pull in is on a completely different scale. Their ability to do so will ultimately come down to whether AI delivers tangible utility in the next few years — especially through bespoke, enterprise applications rather than consumer-facing tools like ChatGPT.
For me, the biggest barrier for adoption is our tolerance to work with an imperfect tool in the short term. We expect perfection from AI, yet we tolerate frequent human error in other aspects of life. It’s similar to how autonomous vehicles are held to a higher standard than human drivers, even though human drivers in the U.S. caused 13.2 million car crashes in 2021, resulting in over 42,500 deaths (whereas a Cruise Robotaxi had one serious incident with a pedestrian, and had its Californian license suspended). Similarly, we’re quick to dismiss AI for hallucinations, incorrect or incomplete outputs, even though human researchers regularly make mistakes, miss context, or produce incomplete work. When that happens, we don’t write them off—we revise and iterate the work, clarify the task and improve collaboration. Often, the issue is in how the request was framed or the fact we delegated a too complex task that we should have undertaken ourselves. We don’t reject human research for being imperfect — so why should we expect perfection from AI?
To conclude, I don’t think current AI capex levels are historically unprecedented. If anything, the comparison to the internet boom suggests there’s still room to run. But the level of spending concentrated on a single firm — Nvidia — is unprecedented. Its revenue is projected to make up 24% of total large-cap capex by 2027, far surpassing even IBM’s dominance in the mainframe era.
As for the risk of a bust, this cycle may prove more resilient. Nvidia holds US$43bn in cash, compared to Cisco’s US$6.9bn in 2001 (or ~US$12.5bn in today’s dollars). Google, Meta, Amazon, and Microsoft are sitting on a combined US$350bn in cash and generating US$450bn in annual operating cash flow. Three of them also have over a decade of experience with the disciplined, demand-aligned cloud buildout of the 2010s.
Today’s AI build-out is still in its early days (it’s hard to believe ChatGPT 3.5 was only launched in November 2022, just 2 ½ years ago). As investors, we need to be extremely cautious with how we invest in both the infrastructure supplier (which will be most leveraged to supernormal profits at the outset) and the infrastructure owners. In the former, we need to very careful not to become owners in the final years of the buildout. In the latter, we need the patience to wait for the monetisation effort to start many years into the future. The best-case scenario is that we see a similarly measured buildout as was the case with cloud infrastructure. So far, this appears to be the case, with Microsoft stating on its earnings call last week that AI margins are performing much better (the term they used was “by far”) vs cloud margins at a similar point in their adoption cycle.
However, whatever happens to the profitability of the companies involved, history suggests one thing with high confidence: the ultimate winner of foundational capex waves is us – the consumer. Whether it was railways, electrification, highways, mainframes, the internet, or cloud computing — society moved forward in a step-change. I strongly suspect AI may well be next in line.
[1] The railway mania of the 1860s and financial innovation, Andrew Odlyzko (March 2024)
[2] The Market for Capital and the Origins of State Regulation of Electric Utilities in the United States, William J. Hausman, John L. Neufeld The Journal of Economic History, Vol. 62, No. 4 (Dec., 2002).
Ian Graham is a Senior Analyst at Te Ahumairangi Investment Management
Disclaimer: This article is for informational purposes only and is not, nor should be construed as, investment advice for any person. The writer is a shareholder of Te Ahumairangi Investment Management Limited, and an investor in the Te Ahumairangi Global Equity Fund. Te Ahumairangi manages client portfolios (including the Te Ahumairangi Global Equity Fund) that invest in global equity markets. These portfolios hold shares in the following companies mentioned in this column: Microsoft, Alphabet, Meta, Nvidia, Cisco, IBM, Oracle, Broadcom and Amazon.