How much Diversification?
NBR Articles, published 25 April 2023
This article, by Te Ahumairangi Chief Investment Officer Nicholas Bagnall,
originally appeared in the NBR on 25 April 2023.
How diversified should an investment portfolio be? Different people have radically different views on this, with some advocating hyper-diversified investment portfolios, whilst others make the case for highly concentrated portfolios.
The practice of diversification is similarly varied. For example, the NZ Superannuation Fund holds investments in 3,277 different listed equities, with the largest single investment (Apple) representing just 3.24% of the total. At the other end of the spectrum, many equity funds own just 20 to 25 securities, and while Warren Buffett’s Berkshire Hathaway has the same favourite stock as the NZ Superannuation Fund (i.e. Apple), he holds it in a far less diversified manner: Apple shares represent about 45% of Berkshire Hathaway’s listed equity portfolio.
In this column, I’ll discuss some of the arguments for and against different levels of diversification.
The theoretical perspective
Diversification of investments – i.e. not putting all your eggs in the same basket – can clearly help to reduce the downside risk of an investment portfolio.
For example, think of a portfolio of short-term bonds that each pay an interest rate of 7%, but carry an annual risk of default (with a consequential complete loss to the bond holder) of 2%. On average, you’d expect a 5% return from such bonds (i.e. the 7% yield minus an average 2% loss due to credit defaults). But if you only invested in one such bond each year, you would be likely to eventually lose your entire investment portfolio to a single credit default. But if you held small investments in 100 of these bonds, it is extremely unlikely that the majority of them would all default at once, so your downside risk would be substantially reduced.
Diversifying by investing in every available stock has the same expected return (on average) as investing in a single randomly selected stock, but holding a diversified portfolio can involve substantially less risk, regardless of whether you measure risk in terms of potential downside or volatility.
For this reason, diversification is often described as a “free lunch” in investing. From a naïve starting point where every stock is seen as delivering the same prospective return, increasing diversification reduces risk, but doesn’t affect return.
How diversification effects risk
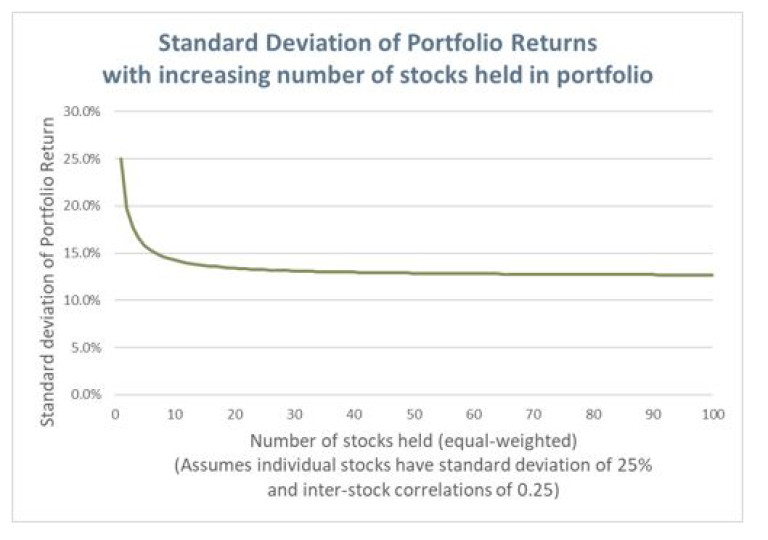
Most of the benefits of diversification come early. Increasing an equity portfolio’s holdings from one stock to five equally weighted stocks will achieve a far greater reduction in risk than diversifying from 5 holdings to 1000 holdings. This demonstrated in the graph below, which shows that as you increase the number of stocks held in a portfolio beyond a single stock the standard deviation (variability) of returns falls dramatically, but there is only minor risk reduction once you go past 30 equally-weighted stocks.
Portfolio concentration is not just about the number of stocks held
I made a few assumptions to construct this graph.
Perhaps the most critical assumption is that the stocks are held in equal weight. In truth, the risk-reduction benefits of diversification come from reducing the proportion of the portfolio held in the largest holdings, rather than from lengthening the “tail” of small holdings held in an investment portfolio. Hence, a portfolio of 200 stocks could still be very un-diversified if it consisted of two large holdings each representing 25% of the portfolio plus 198 other holdings each representing 0.25% of the portfolio.
Correlation is important
The extent to which the returns of different stocks correlate with each other is also important. If all the stocks in a portfolio tend to move up and down together, then you will get very little benefit from diversification. For the graph above, I assumed that the average correlation between any two stocks held in the portfolio was 0.25, which is about an average correlation between the returns of two randomly selected large cap global stocks when measured from an NZ dollar perspective. Inter-stock correlations are often higher within a single market, which means that there’s less benefit from increasing the number of stocks you hold if you’re only investing in a single equity market.
I have noticed that many investors and fund managers tend to hold large proportions of their portfolios in stocks that are very correlated to each other, therefore limiting the benefits they get from diversification.
Consciously or otherwise, we all tend to have our own biases towards certain types of investments. Investors who are not discipled about identifying and managing their internal biases often end up with a large proportion of their investment portfolios invested in companies that have certain characteristics in common. Such investment portfolios can be very vulnerable to poor performance when investment markets turn against those investors’ particular biases.
There were some truly awful fund performances in 2022. When we look at the worst performing funds to try to comprehend how it was possible to have lost so much money in 2022, we invariably find that many of those funds’ largest holdings had similar characteristics, and therefore tend to move up and down together. For example, monthly returns of each of 6 largest tech-related companies (Apple, Microsoft, Amazon, Alphabet, Nvidia, and Meta Platforms) are highly correlated, and many funds are heavily weighted in these companies, as well as being heavily weighted in other companies that are highly correlated with the mega-cap tech leaders (such as Tesla, ASML, salesforce.com, Adobe, Intuit, and Paypal). I have seen similar concentrations of risk in the portfolios that some NZ financial advisors have put together for their clients.
Another more recent example of poor diversification is that a few funds around the world have been hit by holding large investments in both Signature Bank and SVB Financial as well as having a high proportion of their financial sector investments in other struggling US regional banks. This lack of diversification is probably explained by the managers at these funds having a bias towards selecting for strong growth regardless of industry. The reality that they’re now waking up to is that a recent history of strong asset growth is about the best single predictor of how vulnerable a bank will be in the event of a banking crisis.
As an example of how well diversification can work if you can find truly negatively correlated stocks, the graph below shows the returns you would have got from investing Nestlé and TotalEnergies (two of the largest listed European companies) over the past 4 years. Over the full period, both stocks have produced similar returns (about 11% per annum) which are broadly in line with the aggregate performance of global share markets over the same period. But the ride from investing is either of these stocks on its own (particularly TotalEnergies) has been a bit of a roller-coaster. However, the blue line in the graph below shows that if you’d held a two-stock portfolio that was a bit more heavily weighted to Nestlé than TotalEnergies, the ride from holding both stocks would have been a lot less bumpy. This is because TotalEnergies’ zigs often offset Nestlé’s zags (and vice-versa).

In reality, the negative correlation between Nestlé and TotalEnergies seen in the graph above is unlikely to be repeated in the future. While there is some underlying logic behind it (Nestlé’s profitability is squeezed by rising oil prices, while TotalEnergies benefits from higher oil prices), I would expect the returns of these two companies to have a low positive correlation in the future. Persistent negative correlation between stocks is exceedingly rare in the share market.
At the other end of the spectrum, the following graph shows the cumulative NZ dollar returns from investing in Visa and Mastercard. Blind Freddy could see that these two share prices move together, which is hardly surprising since they co-exist in a cosy duopoly.
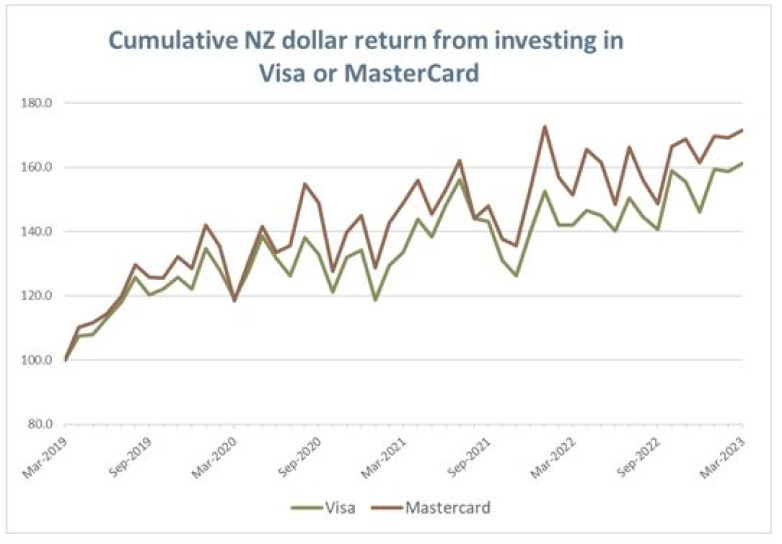
Without looking at this graph, some investors may over-estimate the risk reduction benefit that they’d get from holding both Visa and Mastercard in an investment portfolio. In fact, over this historical time period, the least volatile combination of Visa and Mastercard shares would have been to hold a portfolio that was 100% invested in Visa. Visa’s fixed costs represent a smaller proportion of revenues that Mastercard’s, which means that it tends to be better insulated against any fall in credit card spending. Also, Mastercard’s shares seem to price in a higher growth expectation than Visa’s (maybe reflecting an expectation that market shares of the two companies will equalise over time), which makes Mastercard’s share price more vulnerable whenever the share market stops paying a high premium for growth.
In the discussion so far, we’ve observed that:
- You’ll need more stocks to achieve good diversification if you don’t hold each stock in equal weight;
- some stocks are highly correlated to each other; and
- most of us have internal biases that mean that we’ll tend to favour stocks that are more correlated to each other than the average pair of randomly-chosen stocks.
Taken together, these observations suggest that many investors will need to hold a lot more than 30 stocks before they get close to exhausting the benefits from diversification. They also indicate that the benefits of diversification come not just from increasing the number of stocks held, but also from ensuring that you hold different types of stocks, with a good spread of different countries, different industries, different exposures to commodities and currencies, and a varied exposure to different share market “factors” (such as “growth”, “value”, “defensiveness”, “momentum”, index-inclusion, and capitalisation).
Why limit diversification?
From a strictly mathematical perspective, increasing diversification reduces risk and has no effect on return. Even though the first graph above showed that incremental benefits from diversification will have largely flattened out once you’re approaching 100 stocks in a portfolio, investors may ask “Why stop there?” given that there is also no cost to holding more stocks.
This argument certainly applies to passive investment. If you’ve chosen to invest passively and don’t need to know anything about the companies you’re investing in, then the more the merrier, particularly if you’ve outsourced the paperwork to a passive manager who will do all the admin required with holding so many stocks. If I was investing in a passive fund, I’d likely favour a passive fund that went right down the capitalisation spectrum, holding thousands of stocks rather than a few hundred. Such funds may also have benefit of using less commonly-followed benchmarks, and might therefore avoid participating the clear stupidity that can be observed whenever a stock is earmarked for inclusion in a commonly-followed benchmark such as the MSCI Standard Indices or the S&P 500 index.
Trading off the benefits of diversification against the benefits of focus
For actively managed portfolios, there can be a clear trade-off between the gaining benefits of diversification and achieving the benefits of fully understanding what you’re investing in.
The need to fully understand companies is not such an issue for purely quantitative managers, who don’t pretend to fully understand what they’re investing in, and instead select investments based on an array of quantitative factors than they expect to help to predict outperformance slightly more than half of the time. With good data feeds, it is fully possible for a quantitative manager to screen thousands of companies and only spend a few minutes checking the quality of the data for each of the several hundred companies that rank most highly on their quantitative screens.
But for investors and fund managers who make qualitative assessments of the companies they invest in, it is important to limit how many companies we invest in, to make sure that we have time to fully understand those companies. Some historical academic studies using data from the 1970s through to the early 2000s indicated that funds which held more concentrated (= less diversified) portfolios had on average achieved better returns than funds that had higher levels of diversification.
While there is possibly some survivorship bias in these results, it also intuitively makes sense that competent fund managers who (1) thought they had a strong reason to believe that certain companies would generate strong returns and (2) were willing to hold large positions in these companies (despite a prevailing belief in diversification for most of the historical period) would often end up generating the strongest returns. It is also likely that fund managers who could spend more time really getting to know a handful of potential investments could have made better investment decisions than fund managers who spread themselves thinly keeping up with hundreds of different companies.
Since these academic results have become well known, there has been a tendency for some wholesale managers to market their products as having the “virtue” of high concentration, because they know that potential clients know that higher concentration has historically been associated with stronger investment performance. In some cases, the same individuals who are managing highly concentrated funds are also managing other funds that hold hundreds of different securities. To my mind, this observation shows a cynical exploitation of the historical studies and/or a lack of comprehension of the underlying reason behind the historical results.
Fund managers who market concentrated funds because that’s what their clients want are arguably following the same vicious cycle that animals and humans play when they’re trying to select and attract a good sexual partner. Animals of one gender evolve an attraction to some characteristic that helps to indicate a worthy mate, and then the animals of the opposite gender evolve or learn to exaggerate whatever characteristic had historically been a good predictor of a good life-partner. Fund managers who spread themselves thinly over multiple portfolios holding hundreds of securities and then market a “high conviction portfolio” that holds just a few securities are employing the financial market equivalent of silicon breast implants or the ridiculously large antlers of the extinct Irish elk.
Psychological Benefits and Costs of different levels of concentration
I personally manage two very similar portfolios that hold investments in more companies (150 – 200) than are mathematically needed to achieve 95% of the benefits of diversification. This number of companies can represent a challenge in terms of staying fully informed about every company, and I therefore frequently think about whether I ought to take a harder line on culling the tail of small positions I hold in these portfolios and correspondingly increase the size of the largest positions, to ensure that I can stay better informed about the companies that we do invest in.
In my view, the right sizing of positions held within an actively managed portfolio needs to be grounded in what size of position will allow the manager of the portfolio to make the most rational decisions regarding the management of a portfolio. Making rational decisions not requires good understanding of the stocks and companies that you’re making decisions about, but it also needs you to think clearly, without having your decision-making clouded by “psychological noise” such as hubris, wishful thinking, regret aversion, confirmation bias, etc.
What I’ve learnt for myself at least is that I make the best decisions about companies that I’ve followed closely for some time, and that the best way of ensuring that I keep informed about a company is to have something invested in it, but that it can be more of a struggle to make a truly rational assessment of a company’s prospects (particularly when faced with adverse news) if I’ve “bet the ranch” on the company. It is easier for me to recognise and accept mistakes in my previous judgements if this does not lock in a huge loss. For this reason, I believe that I’ll make the best investment decisions if I generally limit the largest positions in the portfolios I manage to no more than about 3% above their weight in the benchmark index. I have also found that I’ve historically tended to do a reasonably good job at scaling relative position sizes (such that the weighted average return of the stocks I invest in is generally better than the simple average), which means that even if my largest portfolio holdings is 3%, I’d need a lot more than 33 holdings to fill up the portfolio.
This of course is personal. Everyone is affected by their own psychology in slightly different ways, and what one investor finds to work well for themselves may not work so well for others.
Individual investors will also not have the same time to research their investments that I have as a full-time fund manager (with a team of analysts to support me) and many individual investors would therefore struggle to stay informed about the companies they’re investing in well before they get to 30 companies.
Some diversification brings huge benefits, but the benefits from further diversification decline sharply. Once you’ve achieved a broad spread of sectors, countries, and investment characteristics (which could be done with as little as 30 stocks), the right level of diversification for an actively managed portfolio is more dependent on what best helps the manager of the portfolio to make rational investment decisions than on the mathematics of how diversification reduces risk.
Nicholas Bagnall is Chief Investment Officer of Te Ahumairangi Investment Management
Disclaimer: This article is for informational purposes only and is not, nor should be construed as, investment advice for any person. The writer is a director and shareholder of Te Ahumairangi Investment Management Limited, and an investor in the Te Ahumairangi Global Equity Fund. Te Ahumairangi manages client portfolios (including the Te Ahumairangi Global Equity Fund) that invest in global equity markets. These portfolios include holdings of some of the companies mentioned in this column, including Nestlé, TotalEnergies, Visa, Apple, Microsoft, Amazon, Alphabet, Meta Platforms, and Adobe.