Making sense of volatility
NBR Articles, published 30 April 2024
This article, by Te Ahumairangi Chief Investment Officer Nicholas Bagnall,
originally appeared in the NBR on 30 April 2024.
Sensible investors will appreciate that a realistic expectation for global equity markets (in aggregate) is for long-term returns to exceed inflation by about 5% or 6% per annum. Essentially, the reason for only expecting modest returns over the long term is that the total value of the share market can only rise in proportion to size of the global economy, and total returns to shareholders are the sum of growth in share market value plus the (relatively modest) net cash yield that companies distribute to their shareholders.
It should also be obvious that it is not easy to find equity investments that we can be confident of delivering returns that massively exceed this average. If it was easy, then it would not be such a rarity to find fund managers that have beaten their benchmarks by more than 2 or 3% over the long term.
In our experience, we rarely find companies that we expect to deliver long-term returns of more than 10% per annum. Accordingly, we love it when we can find companies with a low-to-average risk profile that we think will produce long term shareholder returns that exceed inflation by 7% or 8% per annum.
But having spent a lot of time looking for companies that we think will produce these sorts of long-term returns, we sometimes find that the share market delivers the sort of returns that we hope to achieve over a year in a much shorter period of time. Sometimes this occurs over just one or two days. How should we make sense of this?
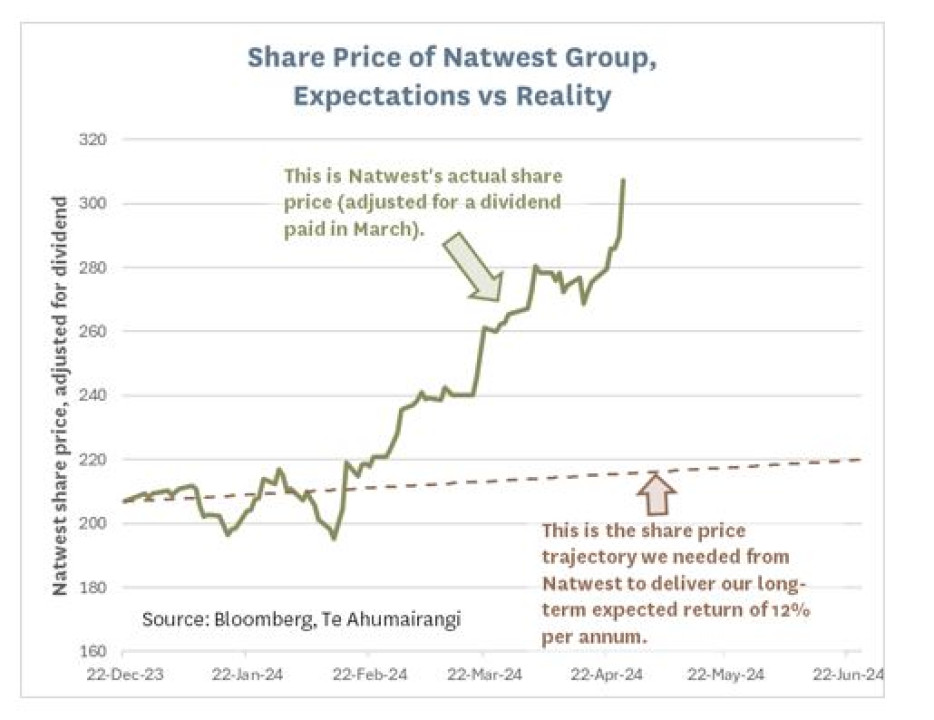
For example, the following graph shows the share price of Natwest Group since we began buying it on the 22nd of December last year (the graph has been adjusted for a dividend paid in March). When we began buying Natwest, we had what we considered an unusually bullish expectation for the long-term return that we would achieve from investing in the stock (12% per annum). However, the share price has risen much faster than this, producing a shareholder return of about 50% over 4 months. There were 3 individual weeks (out of the past 18 weeks) when it returned more than 8%.
This article discusses share market volatility, exploring the implications of share prices often showing more movement over a few days than the returns that long-term investor may expect over the course of a year.
Nvidia
Consider the share price of Nvidia, the world’s third most highly-valued company. Over the past three weeks, the daily standard deviation of Nvidia’s share price has been 4.2%. Each day, the share market has effectively been saying (on average) that Nvidia is either 4.2% (US$92 billion) more valuable or 4.2% less valuable than it was in the previous day.
Following the human tradition of evoking gods to explain things that we find hard to understand, imagine that there is a god of financial markets who tosses a coin each day. If she gets heads, Nvidia becomes 4.25% more valuable than the day before, and if she gets tails Nvidia becomes 4.15% less valuable than it was the day before. This deity-based model is pretty much observationally equivalent to the “random walk” (efficient market) hypothesis for movements in share prices.
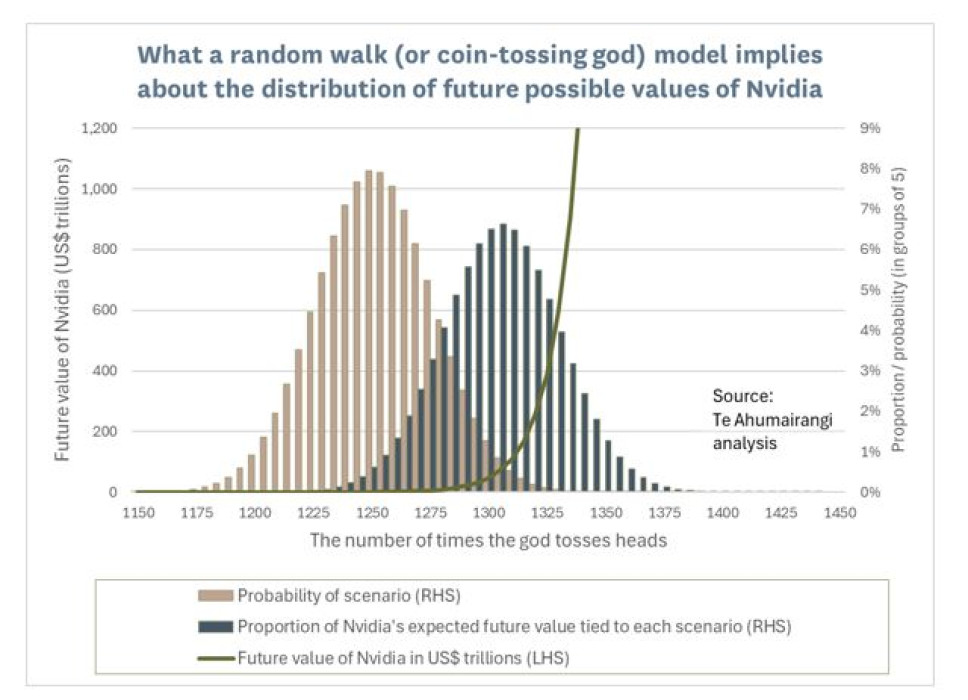
 So what will end up happening if the god keeps on tossing her coin for several years? If she tosses a lot more heads than tails, Nvidia could end up being extremely valuable, but if she tosses more tails than heads, it could end up being worth much less than its current market capitalisation of US$2.2 trillion.
This model implies that the expected long run return from Nvidia is 0.05% per business day (the average of heads +4.25% and tails -4.15%), equivalent to a 13.3% per annum return. This implies that we should expect a 3.5-fold growth in Nvidia’s value over the next decade (as an average of all scenarios). However, the repeated coin tosses also imply a lot of potential dispersion around that expectation.
Is a random walk realistic?
Is the coin-tossing model a realistic predictor of how Nvidia’s value could change over time?
On the downside, maybe. If the god of financial markets keeps tossing her coin each business day for 10 years, she will toss the coin about 2,500 times. For a fair coin, the central scenario is that she tosses 1,250 “tails” and 1,250 “heads”, but there is a 2.7% probability that she tosses “heads” 1,200 times or less (and correspondingly gets “tails” at least 1,300 times). Such a scenario would result in the market value of Nvidia falling more than 99.4% to US$13 billion (or less).
This is not entirely implausible, as (while rare) there are a few precedents of companies that have started out with a clear leadership position in a rapidly changing industry, but dropped back to become almost worthless over a period of several years. For example, AOL once was the dominant player in internet service provision and Yahoo! was the dominant player in internet search and indexing. At the end of 1999 these two companies ranked amongst the world’s most valuable, and had a combined market capitalisation of about US$300 billion. But in 2021 Verizon (which had ended up owning both) sold the two companies to private equity interests for a combined sale price of about US$4.5 billion.
Now let’s consider the upside case for Nvidia. The “god tossing coins” model implies that there is a 2.7% probability that the god tosses “heads” at least 1,300 times (and correspondingly gets “tails” no more than 1,200 times). Under our “god tossing a coin” model of financial markets, this would correspond to a 25.7-fold increase in Nvidia’s value, to US$56.3 trillion by 2034. If the rest of share market grows in value by 4.5% per annum over the next decade, this implies that Nvidia would account for over a third of the total value of global equity markets by 2034.
To my mind, this scenario is highly improbable, and without precedent in the history of capitalism. There will be many competitors to Nvidia that prevent it from becoming sufficiently profitable to justify a US$56 trillion valuation, and if these competitors fail to win market share, there will be anti-trust regulators keen to split up Nvidia and take away its pricing power well before it is valued at US$56 trillion.
If the “god tossing coin” model doesn’t work, how can we fix it?
To make the model more realistic, one approach would be to use a truncated version of the “god tossing coins” model for Nvidia’s share price, where we might accept that Nvidia’s share price could follow a random walk in the near term, but impose some arbitrary cap (say US$ 50 trillion) beyond which we don’t think that Nvidia’s market capitalisation could ever be sustained.
A cap on Nvidia’s value of US$50 trillion may seem so far removed from the current reality that you might think that imposing this cap poses no meaningful threat to the efficient market concept of share prices following a random walk. But the reality is that if you use the random walk model to explain a share price as volatile as Nvidia’s, then you are effectively saying that the majority of the expected future value of Nvidia comes from the small possibility of it being worth more than US$50 trillion.
I show this in the graph below, where you can see that although my assumption of an average daily return of +0.05% implies that the expected future value of Nvidia is 3 ½ times its current value, this expected value simply represents the weighted average of all possibilities. Under this model, less than 2% of the expected future value of Nvidia comes from all the scenarios where the god of financial markets throws more tails than heads. On the other hand, 33% of the expected value of Nvidia comes from the hypothetical 0.03% probability (according to this model) that Nvidia’s market value could be more than US$1 quadrillion in ten years’ time!
 If you accept that there is some sort of cap on how valuable a company can become, the random walk theory (or my suggested equivalent, the god-tossing-coins hypothesis) becomes inconsistent with the idea of efficient markets for a company as volatile and highly-valued as Nvidia.
If you rule out the possibility of the extreme upside implied by a random walk (but accept the random walk model up to US$ 50 trillion), then Nvidia looks to be a poor investment, as its weighted average expected future value (from the remaining scenarios) is not much higher than its current value. To conclude that the weighted average expected value of Nvidia is sufficiently higher than its current value, you need to either accept that there is a meaningful possibility of future values in the hundreds of trillions, or you must rule out pretty much all of the downside implied by a random walk. And if you’re modifying your random walk theory to rule most of the downside as well as the extreme possibilities for upside, then it’s no longer a random walk.
In summary, a share price as volatile as Nvidia’s for a company with a market capitalisation of Nvidia’s could either be (1) fairly valued or it could be (2) following a random-walk-with-a-cap. But it cannot be both. This volatility is a challenge for the efficient markets hypothesis, which states that security prices are fairly valued and follow a random walk.
In reality, a share price as volatile as Nvidia’s tells us that no one truly has a clear idea as to what Nvidia is really worth. If investors had a strong perception of what Nvidia was worth, then we should be expecting them to add to their holdings when its share price declines and to be trimming those holdings when the share price rises. If there were in fact many investors doing this, their collective actions would result in a lowering in the volatility of Nvidia’s share price.
Do share prices really follow a random walk?
The random-walk / coin-tossing model is easy to test. If share prices really follow a random walk, then there should be no relationship between how share prices change on one day and how they change on the following day.
In the graph below, I show the results of an exercise I did (using Bloomberg’s factor testing module) to see whether there is in fact no relationship between returns on one day and returns on the next. For this exercise, I focussed on US stocks that are members of the MSCI US index. These tend to be highly liquid stocks for which you can reliably buy or sell large quantities at each day’s closing price.
For my back-testing, I had Bloomberg sort these stocks into 10 different buckets each day, ranked on the basis of their one-day return (including dividends). I (that is, Bloomberg) then looked how each bucket of stocks performed over the following day, and repeated the exercise for each day of the analysis period. I applied this analysis over a period of 20 years, from 27 April 2004 through to 26 April 2024.
Each day the stocks were ranked from bucket “D1” representing the 10% of stocks that had shown the worst daily return over the previous day through to “D10” representing the 10% of stocks that had shown the best daily return.
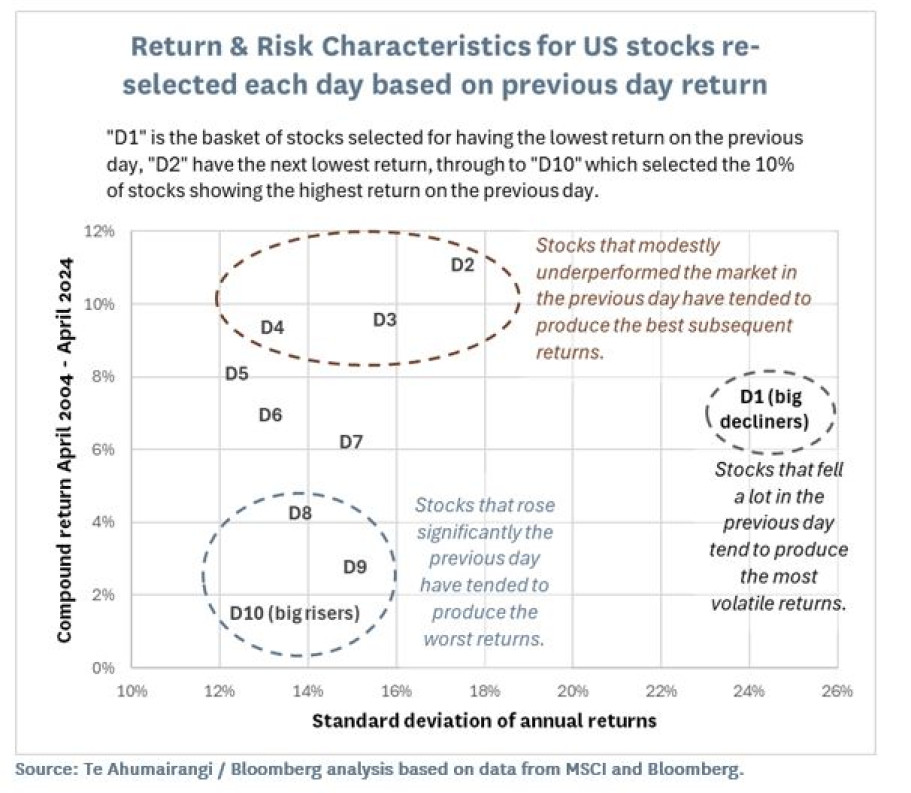
This analysis showed that daily returns are noisy, and that investors would have generally done well betting that one-day share price movements would reverse, rather than betting that they would continue to move in the same direction. In particular, stocks that have outperformed over the previous day have a strong tendency to under-perform the market on the following day. Conversely, stocks that have modestly underperformed the market (ranking between the 10th and 50th percentile of return) tend to produce above-average returns over the following day.
However, buying the biggest decliners on each day was not a great strategy. Although the worst 10% of stocks from the previous day tended to produce returns that were marginally above average over the following day, the returns from a strategy of investing in big decliners was particularly volatile, such that it did not represent a good combination of risk and return.
Some of these results proved to be remarkably consistent. For example, the return from investing in stocks that ranked in the second worst decile of returns over the previous day has outperformed the average stock in every one of the past 20 years (using the year to the 26th of April in each case). Conversely, the return from investing in stocks that ranked in the top decile of returns over the previous day has underperformed the average stock in 17 of the past 20 years.
Of course, a daily strategy of buying stocks that had declined modestly over the previous day whilst selling stocks that had shown the largest rises would not be profitable on a net-of-costs basis for anyone paying standard commission rates, as it would require huge amounts of buying and selling. However, the exercise is valuable because:
- It shows that, contrary to the predictions of the efficient market hypothesis, stocks do not really follow a truly random walk. Shares are more likely to reverse direction from one day to the next than they are to continue in the same direction.
- It gives valuable information that we can incorporate into our decision-making when we’re thinking about buying or selling equities. Generally, if we’re thinking about selling a holding, we’re best to do this at the end of a day when the stock has been strong, but if we’re thinking about buying a stock, we’re best doing this at the end of a day when the stock has underperformed the market (although we should be wary about buying the very worst performing stocks in any day).
Evaluating stocks with a wide dispersion of future values
Although it is over-stated by the random walk model (which assumes that there is no tendency of stock prices to reverse direction from one day to the next), there is a lot of truth to our earlier observation that the volatility of stocks like Nvidia indicates a particularly wide dispersion of possibilities about Nvidia’s future value. However, human brains are often not very good at thinking about a range of possibilities, and many investors prefer to focus on a single “story” for how they think the future will unfold for a particular company.
Focussing on a single scenario for the future works best for companies that have a relatively predictable future. For example, if you’re evaluating a diversified consumer staples company (like Proctor & Gamble or Nestlé or Unilever), you will model its outlook by thinking about assumptions like whether its sales will grow at 3.5% per annum or 4.5% per annum, whether its future margins might be slightly higher in the future or slightly lower in the future than they have been in the past, and whether the amount of capital it needs to have invested in its business might grow slightly faster than sales or slightly slower than sales. You’ll probably be slightly wrong for each of these assumptions, and these companies could also face some unexpected competition or product recalls for one or two of their product lines, but at the end of the day you’ll still be invested in a business that’s generating a lot of cash and growing modestly, and the future performance of these companies will probably be passably similar to what your models had predicted.
But in technology and other rapidly-changing businesses, there can be significant upside and downside risks that are difficult to model. No-one really knows how big the future market will be for Nvidia’s GPUs – it may keep on growing until it is 20 or 30 times larger than it is today, such that Nvidia grows to become the world’s most valuable company, but it is also conceivable that the current boom in spending on AI-centric data centres will prove to be a fad, and that in two years’ time corporates may be pulling back on their AI spending because they’re failing to see a return on investment. There is also the possibility that one of the dozens of VC-backed companies currently developing their own AI-focussed chips will eventually eclipse Nvidia as the market leader. Accordingly, it is impossible to build a single model that can be tweaked in minor ways to capture all the possibilities for Nvidia’s future cashflows and profitability.
An important point here is that to buy shares in a company like Nvidia, it is insufficient to simply convince yourself that there is some scenario for the future whereby the growth in Nvidia’s value (combined with the cashflows it delivers to shareholders) will generate a good return on investment, because there are also many scenarios where Nvidia proves to be a lot less valuable than it is today.
However, I think that a lot of the demand for Nvidia shares is currently coming from worried benchmark-aware fund managers who are finding that they can now imagine 3-fold increases in Nvidia’s value over the next decade (corresponding to potential returns of 11.6% per annum) based on a single scenario for Nvidia’s future. These nervous fund managers figure that since Nvidia is a large part of their benchmark index (for example, it is now represents about 5% of the S&P 500 index), they should hold at least some shares in it if they can see the possibility of double-digit returns.
What these benchmark-aware fund managers are missing is that in a stock as volatile and highly valued as Nvidia, there are a whole range of scenarios where it delivers no growth in value over the next decade. And the lack of any growth in value implies a loss of over 60% of today’s capitalisation in present value terms. To compensate for this potential downside, investors need a counter-balancing upside. In other words, they need to be able to envisage meaningful probabilities for scenarios whereby Nvidia might be worth US$15 trillion or more by 2034. While strong enough drugs might solve this problem for them, I don’t believe that it is realistic to assume that there is a meaningful probability of Nvidia (or any other company) becoming so valuable by 2034.
I have no problem with assigning a probability of around 20% to the possibility that Nvidia could be worth between US$5 trillion and US$15 trillion by 2034, and by my calculations, this potential upside accounts for about US$560 billion (slightly over 25%) of Nvidia’s US$2.2 trillion current valuation. The problem is that all the other scenarios about how Nvidia’s future may unfold (where its future value is somewhat less than US$5 trillion) do not provide sufficient value to justify paying the remaining US$2 trillion of Nvidia’s price tag.
Nicholas Bagnall is Chief Investment Officer of Te Ahumairangi Investment Management
Disclaimer: This article is for informational purposes only and is not, nor should be construed as, investment advice for any person. The writer is a director and shareholder of Te Ahumairangi Investment Management Limited, and an investor in the Te Ahumairangi Global Equity Fund. Te Ahumairangi manages client portfolios (including the Te Ahumairangi Global Equity Fund) that invest in global equity markets. These portfolios hold shares in Natwest Group and Verizon, which were mentioned in this column.