Risk in Retirement?
NBR Articles, published 4 July 2023
This article, by Te Ahumairangi Chief Investment Officer Nicholas Bagnall,
originally appeared in the NBR on 4 July 2023.
Last week, I read an article in Stuff discussing whether $1 million was a sufficient pool of savings to provide for someone’s retirement. While that article focussed on the obvious point that it would depend on how much you were planning on spending during retirement, it did also suggest that investing in a higher risk “growth fund” rather than a balanced fund could allow people to retire with less.
This struck me as a dangerous suggestion, for the simple reason that if you fund your lifestyle by selling a certain dollar amount of an equity portfolio each year, you’re going end up selling more shares in years when the market is down, which means you’ll still be behind plan even if the market recovers.
For example, consider the example of someone who’d retired at the age of 65 at the end of 1999 with the inflation-adjusted equivalent of $1 million today (that was $560,474 in 1999 dollars), and an intent to draw the inflation-adjusted equivalent of $40,000 out of their portfolio each year ($23,310 in the year 2000). Since the end of 1999, unhedged global equities have returned 4.9% per annum (before tax or fees), handily ahead of inflation of 2.5% per annum, so you might naively assume that our hypothetical retiree might have been able to provide for all of their expenditure needs up until about now (at age 87) if they’d somehow avoided paying fees or taxes.
If global equities had delivered a consistent 4.9% return each year, the hypothetical retiree from 1999 would still have a little bit left now, at the age of 87, but “consistent” and “equity return” do not normally belong together in the same sentence (particularly for some of the more growth-orientated equity funds that thrived in 2020-2021 before getting smashed in 2022).
Unfortunately for our hypothetical 1999 retiree, equity returns were particularly inconsistent after 1999. Global equities fell 42% (after adding back gross dividends) in the three years from the end of 1999 to the end of 2002, and the bleed from selling equities to fund withdrawals would have seen this hypothetical retiree’s investment portfolio more than halve in value by the end of 2002. Although equity markets have done well since 2002, the diminished size of the retiree’s portfolio would have meant that it was insufficient to fund the intended level of spending, and the poor retiree would have run out of money about half-way through 2016, when they would have been 81 years old.
Share market volatility can arguably work in the favour of younger people who are investing incremental amounts into the share market each year (provided that they’re not prone to changing their asset allocation whenever it hurts them or whenever they hear bearish opinions in the media). Such savers will end up accumulating more shares when the market is down and may therefore end up benefitting from market downturns if share market valuations ultimately recover.
Over the long term, younger savers may benefit from a slight tendency for decades of poor share market returns to be followed by decades of superior market returns (and vice-versa). But this eventual reversion would likely be too late for retirees who are drawing on a significant percentage of their investment portfolios each year.
Given the differences between how younger savers and older retirees are likely to be affected by share market downturns, I thought it would be an interesting exercise to do some modelling to help understand how higher allocations to equities might affect the probability of a retiree being able to fund all their retirement ambitions.
To do this, I did Monte Carlo analysis simulating 3,000 different possibilities about how investment returns might unfold over the next several years, and looked at how these 3,000 scenarios might affect a population of 10,000 retirees, with remaining life expectancies marginally longer to those for a 65-year-old New Zealand women (I used slightly lower mortality rates than shown in the NZ life tables, because on the assumption that people with investment portfolios are likely to have slightly better than average health, consistent with the general correlation between socio-economic status and health outcomes).
The outcome I focussed on was whether people retiring with an investment portfolio of $1 million who were drawing $40,000 per annum out of their investment portfolios (and increasing this withdrawal at an assumed inflation rate of 2.5% per annum) would be able to keep drawing this amount out each year until they die, or whether the money would run out first.
The graph below illustrates the range of modelled possibilities for retirees investing in conservative investment portfolios, with just a 20% allocation to equities. This analysis suggests that people dying before the age of 85 are likely to be able to keep on spending until the day they die, but if they live to past 90, it becomes increasing likely that their investment portfolios could run out of money. Essentially, the problem is that after taking account of both taxes and funds management / financial advice fees, these conservative investors will most likely earn an investment return that is only marginally better than inflation (I assume an average nominal post-tax post-fee return of 3.22% per annum), so as they draw money out of their investment portfolios, the value of those investment portfolios will most likely fall over time.

Overall, this modelling suggests that almost 30% of people starting with a $1 million investment portfolio and spending $40,000 per year (inflation adjusted) will run out of money before they die if they hold a conservative investment portfolio with just 20% in equities. Of course, the remaining 70% do get to keep taking $40,000 per year (inflation adjusted) out of their investment portfolios for their remaining lifetime.
Whether these retirees are outlived by their investment portfolio depends mainly on the age at which they die. Almost everyone who dies before the age of 85 will be outlived by their investment portfolios, but about 70% of people who survive past the age of the 90 would end up outliving their investment portfolios.
So could these results be improved by holding more equities? The graph below shows the same exercise if the retirees held a 60% weighting in equities. There are two offsetting affects at work here. Firstly, I’ve assumed that the post-tax post-fee return from these portfolios will be an average of 1.3% higher than the returns from the portfolios that held a 20% weight in equities. This is consistent with empirical evidence that equity markets have generally delivered better returns than fixed interest over the long term.
This higher average return means that for the first few years, the average portfolio is growing in nominal value despite the retirees’ withdrawals (although not growing by enough to keep up with inflation). But the second effect of having more equities is that there is a greater risk of a significant decline in the value of portfolio early on in retirement, such as the example I gave earlier for what could have happened to people retiring in 1999.
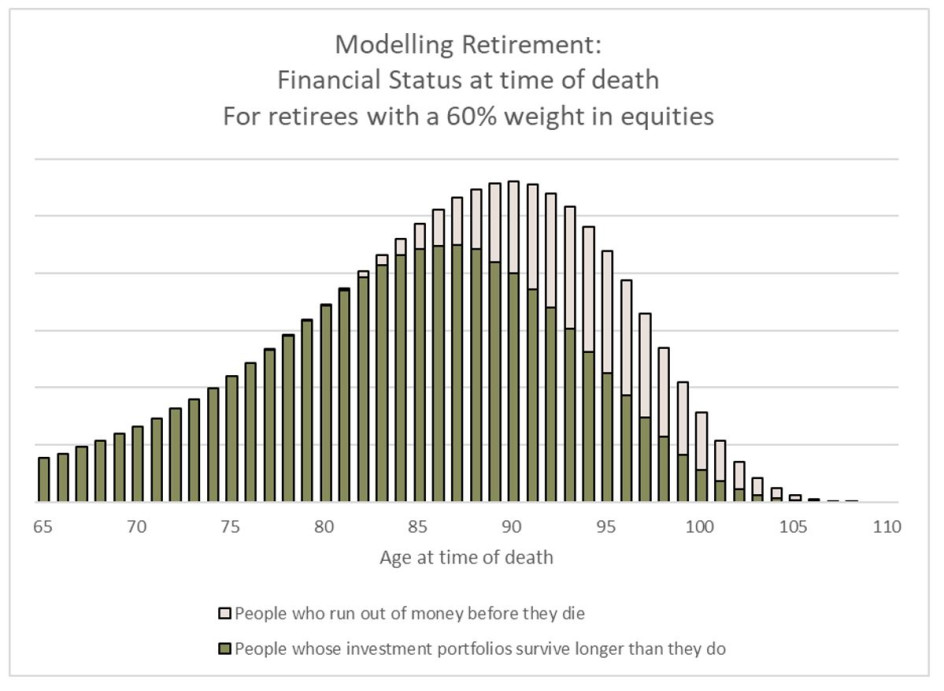
Overall, this modelling suggests that 22% of people putting 60% of their retirement portfolios into equities would run out of money, while the other 78% would be survived by their investment portfolios. This is a lower proportion of people that would run out of money than was the case for the conservative portfolios with just a 20% weighting in equities, suggesting that having 60% of a retirement portfolio in equities is in some ways less risky than the retirement portfolio with just a 20% weight in equities.
This was a slightly surprising result for me – when I started this modelling exercise, I expected it to show that a 60% allocation to equities would have a similar or even slightly higher risk for retirees than a more conservative allocation of 20%.
So how about if we go even further, and look at retirement portfolios that are 100% invested in equity markets? I show the results for these portfolios in the graph below. Overall, these results show that a 100% allocation to equities creates a slightly higher risk of running out of money than was the case for retirees with 60% of their portfolios in equities. In particular, investing 100% of your retirement portfolio in equities would create a greater risk of running out of money at a relatively young age (e.g. less than 85) compared to a portfolio that was 60% allocated to equities.
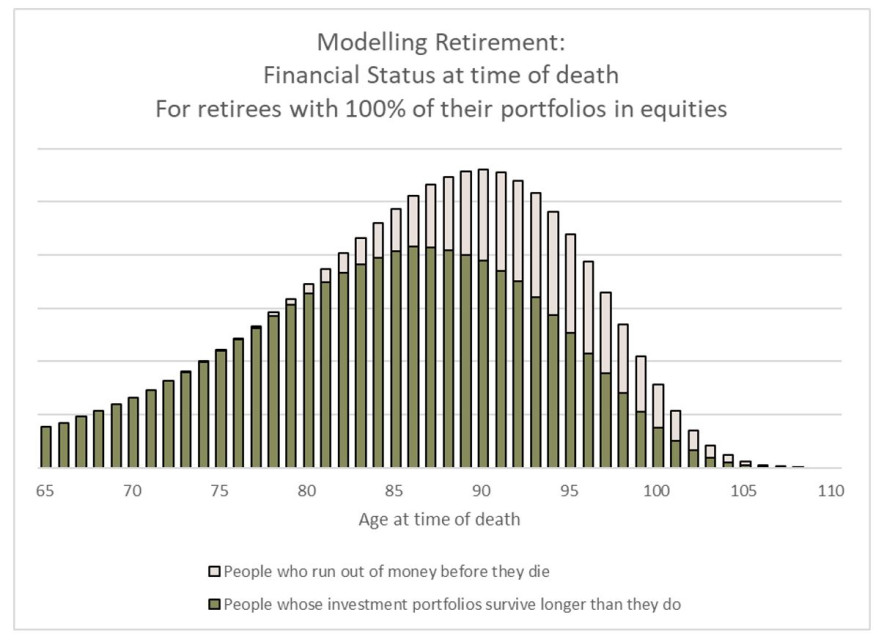
Taken together, these results suggest that it could make sense for retirees to continue to have a significant allocation to equities (e.g. 60%) but that moving all the way to a 100% allocation to equities is likely to increase the risk that their retirement portfolios could run out of money before they run out of years.
Of course, the results of any modelling exercise such as this are dependent on the model and the assumptions. Some of the areas where my modelling might fall short of reality include the following:
- I assumed that investment returns would be normally distributed. In reality, share market returns exhibit a “fat-tailed” downside risk, sometimes falling far further than could have been anticipated based on the application of normally distributed bell curve to the historical standard deviation of the share market. This would be a reason for being cautious about large allocations to equities.
- My modelling assumes no inflation risk. The risk of runaway inflation could be a reason to avoid too high allocations to fixed interest, which could perform particularly poorly if inflation got out of control.
- I assumed that each retiree’s allocation to equities would have a similar standard deviation to the overall share market. In reality, many “growth orientated” equity portfolios have a significantly higher standard deviation than the market. By my count, six of the seven largest global equity funds offered in New Zealand have a historical standard deviation of returns that is at least 1% higher than the standard deviation of the MSCI All Countries World index. (Investors should not assume that more risk always means more return: while historical evidence strongly indicates that investors receive a risk premium when they switch from fixed interest to equities, the weight of evidence leans in the other direction when looking at what you get from adding more volatile equities to a portfolio. If anything, history suggests that investing in more volatile stocks leads to lower returns on average over time.)
- My modelling assumes that retirees pay fees totalling 1% per annum to fund managers and financial advisors. In reality, the total advice, management, and transactional fees paid by many investors are often much higher fees than this. There is scant evidence that paying higher fees results in higher pre-fee returns.
We can also consider how adjusting some of these assumptions affects the probability of ending up destitute.
To accommodate the fact that many people invest in more volatile funds with higher fees, we re-frame the exercise to consider a retiree who invests in a fund with a 60% equity weighting, but with a higher standard deviation of returns (10.73% rather than the 9.73% hat we previous assumed for portfolios with 60% allocations to equities) and higher fees (1.5% rather than 1.0%), Changing these assumptions results in the following output.

For these retirees paying higher fees and investing in more volatile equities, the probability of the portfolio expiring before the retiree does is 28%, markedly higher than the 22% risk of insufficiency that they would face if they’d paid lower fees and held equity portfolios that exhibited similar volatility to the overall share market.
Of course, we can also think about what would happen if the retiree chose to hold 60% in equities, but did this through investing in funds that charged lower fees and held less volatile equities. For the graph below, we assume that the retirees’ portfolios are less volatile than our base case for a 60% equity portfolio (8.73% rather than a 9.73% standard deviation of returns) and that they’re paying lower fees (0.65% per annum rather than the 1.0% p.a. than we assumed in the base case).

The scenario delivers the greatest probability that the retirement portfolio will achieve its purpose out of all the cases we have looked at. In the graph above, 87% of retirees still have funds in their portfolio when they pass away, while just 13% run out of money.
The contrast between these last two scenarios highlights the fact that both fees and volatility should be important investment considerations for people entering retirement. High fees are bad news for all investors, but highly volatile returns should be of greater concern for retirees than might be the case for young savers.
These conclusions do rely on the assumption that higher fees will be a dead-weight loss (i.e. you don’t get what you pay for in funds management) and that within the equity market, there is no incremental reward for choosing higher risk. While I am confident that the empirical evidence has been supportive of both of these contentions over the longer term, there will be some people (not just people selling funds) who may dispute these assumptions.
Nicholas Bagnall is chief investment officer of Te Ahumairangi Investment Management
Disclaimer: This article is for informational purposes only and is not, nor should be construed as, investment advice for any person. The writer is a director and shareholder of Te Ahumairangi Investment Management Limited, and an investor in the Te Ahumairangi Global Equity Fund. Te Ahumairangi manages client portfolios (including the Te Ahumairangi Global Equity Fund) that invest in global equity markets. Te Ahumairangi manages portfolios that charge lower-than-average fees and target lower-than-average risk, and is therefore biased towards the conclusions reached in this article.