Forecasting long-run returns from the US share market
NBR Articles, published 15 August 2023
This article, by Te Ahumairangi Chief Investment Officer Nicholas Bagnall,
originally appeared in the NBR on 15 August 2023.
Every day, a reader of market commentary and broker research will come across numerous views on how the share market is likely to perform for investors over time horizons of one month to one year. But it is exceedingly rare to see “strategists” and market commentators talking about the returns that investors will get if they buy and hold an investment in the share market for the rest of their lives.
Essentially, media-facing market strategists tend to be focussed on speculation rather than investment. In this article, I’m going to try to look beyond these near-term views and talk about the long returns that investors can rationally anticipate from investing in the US share market.
If you invest in a broad share market (for example through a passive fund), you’re buying shares in a broad spectrum of companies, most of which will pay dividends. While the dividends paid by individual companies may bounce around a bit, the aggregate of all dividends paid by all listed companies will tend to be more stable. The aggregate value of these dividends will tend to grow over time in line with growth in aggregate profits.
Ultimately, the value of an investment in shares is linked to the ability of the underlying companies to distribute cash to shareholders. So in the long-term, we should also assume that the aggregate value of the share market will grow at about the same rate as growth in profits and dividends.
The graph below shows the growth in the dividends you would have received if you had invested in the MSCI United States index. Over the last 28 ½ years, these dividends have grown at 6.0% per annum, 3.3% faster than the 2.7% growth in the US consumer price index over the same period. As can be seen from the graph, the trajectory has been generally upward, albeit with a significant dip during the global financial crisis, and smaller dips during the covid pandemic and the tech wreck of the early-2000s.

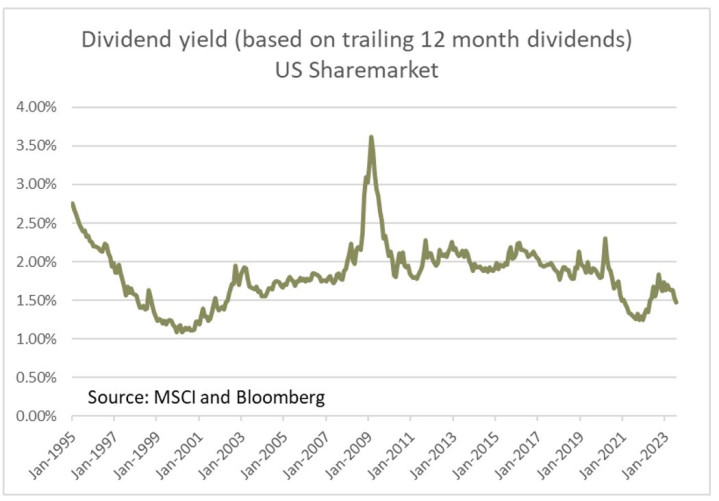
Incidentally, the real growth rate shown in this graph is faster than what we can observe using longer term data. Using Robert Shiller’s online database covering share market statistics over the period from 1971 to 2018, we see dividends out-pacing inflation by just 1.55% per annum, while earnings per share out-paced inflation by 1.83% per annum. As the graph below shows, the dividend yield on US equities is currently close to all-time lows:
Where do long-term share market returns come from?
The total return that you’ll get from buying and holding shares across the entire market essentially comes from two sources: (1) the yield that you get from receiving dividends; and (2) the long-term growth in the per-share value of the share market. Against this, you need to deduct any expenses you might directly or indirectly incur paying fund managers and financial advisers, as well as taxes.
The near-term yield that you will get from investing in a representative index of US companies is pretty much a given. The US share market is paying a dividend yield of 1.47% based on trailing dividends over the past year. On a forward-looking basis this dividend yield should be about 1.55% over the next 12 months.
But the million-dollar question is what long-term growth rate you can reasonably expect from US equities in the future. Ultimately, this must be driven by fundamentals, particularly growth in the capacity for listed US companies to generate profits and cashflows that can be used to fund dividends or share buybacks. The following items should be key considerations when thinking about the future growth you can expect in the per-share value of listed US companies:
1. Growth in the US economy.
Over the last 50, 30, and 10 years, real US GDP has grown at 2.7%, 2.4%, and 2.1% per annum respectively.
It seems reasonable to expect the decelerating trend in GDP to continue, as it corresponds to slowing labour force growth, due to a slowing and aging population. The US labour force has grown just 0.54% per annum over the past 15 years, after growing at well over 1% per annum throughout the 20th century. The demographic profile of the US suggests that about as many current Americans will join the labour force over the next 25 years as will leave it. Since net inward migration into the United States is running at just 0.27% of the population, the balance of probabilities is that growth in America’s total labour force will continue to slow. With the US fertility rate having declined to 1.66, it seems likely that this growth rate will decelerate even further when the current crop of babies reach adulthood.
This demographic headwind combined with the challenges of decarbonisation (which I discussed in my March 2021 column) means that a realistic expectation for long-term growth in real US GDP is probably something in the order of 1.8% per annum. Although there is currently a lot of hype about Artificial Intelligence super-charging economic growth, there was a similar expectation for affordable computing and for the internet, but as we have seen, US GDP growth has been slowing despite America’s relative success at exploiting these technological changes.
Future inflation is anyone’s guess, but the relative pricing of inflation-protected bonds suggests that market participants expect inflation to average about 2.3% per annum over the long-term. Adding this projected future inflation to our expectation for real GDP growth (of 1.8% per annum), it seems reasonable to expect growth in America’s nominal GDP of about 4.1% per annum.
2. Corporate profits as a share of GDP.
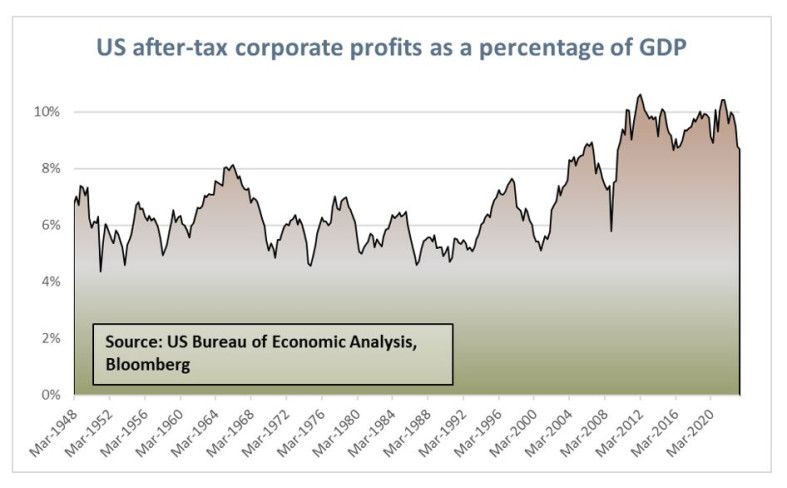
Might it be reasonable to expect that corporate profits could grow faster than GDP over the long term? It should be obvious that this could not occur forever, as it would imply that corporate profits would ultimately exceed GDP, which is of course impossible (as corporate profits are a component of GDP). But if corporate profits started from a relatively low base it might be credible to expect that corporate earnings could out-pace GDP by (say) 1% per annum for a period of 50 years. Just 50 years of an additional 1% growth would add about 0.5% to the internal rate of return that investors could expect from equities for the period between now and the end of time.
Unfortunately, as the graph below shows, corporate profits are not starting from a low base in relation to GDP. Rather, they are markedly higher than they have been on average over the past 75 years, and the historic tendency has been for corporate profits to keep reverting back to a historical average of about 6% to 7% of GDP, rather than to keep trending in one particular direction. Looking at this graph, I consider that the balance of risks is that corporate profits will most likely decline as a percentage of GDP over the next several decades, and I will therefore assume that long-run growth in aggregate US corporate profits will be 0.1% lower than growth in nominal GDP.
3. Dilutionary & anti-dilutionary factors
- Dilution of earnings per shares due to stock issuance (stock-based compensation & other).
- Acceleration of earnings per share growth due to share-buybacks
- Existing listed companies losing share of total earnings to newer companies.
I will introduce each of these issues in turn, before discussing how we can resolve these issues collectively.
Dilution of earning per shares due to stock issuance (stock-based compensation & other):
This is a common problem – the growth in a company’s earning power will not necessarily lead to commensurate growth in the value of its shares if it keeps on issuing more and more shares, such that its earnings per share won’t grow nearly as fast as its total reported earnings. Growth in share count is common in companies that pay employees using stock-based compensation – for example, Amazon’s share count has grown at slightly over 1% per annum due to stock-based compensation. The number of shares can increase much more dramatically in companies that frequently use stock to pay for acquisitions, or in companies that have to issue new equity to get themselves out of a tight financial situation. For example, Bank of America is reporting greater profits than it ever made prior to the Global Financial Crisis of 2007-2009, but its earnings per share are still lower than pre-GFC levels due to the additional stock that it had to issue to shore up its balance sheet during the Global Financial Crisis.
Acceleration of earnings per share growth due to share-buybacks:
Of course, earnings per share can grow faster than aggregate earnings if companies reduce their share counts by buying back shares. Using the “dividend plus growth” model to understand long term returns, we will be indifferent between whether a company chooses to distribute cash to shareholders by share buybacks or by dividends. If a company that might otherwise pay dividends amounting to 3% of its market capitalisation instead chooses to use the cash earmarked for dividends to buy back 3% of its shares each year, this decision will reduce its expected dividend yield by 3% but increase its expected growth in earnings per share by 3%, leaving the “dividend plus growth” expectation of total return unchanged.
As an example of how share buybacks can increase earnings per share, WW Grainger has grown its profits by 9.6% per annum over the past decade, but its earnings per share have grown by 13.2% per annum, as it has bought back an average of slightly over 3% of its shares each year.
Existing listed companies losing share of total earnings to newer companies:
Existing companies can also have their share of total economy-wide profits diluted due to the formation and growth of new companies. If you buy shares in all the companies that are listed today, you should expect the growth in their aggregate profits to ultimately lag behind total economy-wide growth in all profits, because new companies will form, grow, and ultimately account for a large share of total corporate earnings. For example, if you had bought shares in every listed stock 30 years ago, you would have missed out on investing in 5 of the 7 largest companies of today (namely: Alphabet, Amazon, Nvidia, Tesla, and Meta). Of course, you could have bought shares in these companies as they were listed and included in benchmark indices, but to do so you would have needed to have sold some of the shares that you already owned in other companies, and that selling would have diluted your overall ownership of the US share market.
Resolving these issues
How do we resolve the three issues discussed above? We know that each of these issues has the potential to significantly affect the rate of growth in the per share value of the companies that are listed today, but it is less clear whether the “significant effect” of each issue is of the order of 0.3% or 3.0% per annum.
Fortunately, we can look at long term data from share market indices to see the combined impact that these three issues have on the long-term per share value of listed companies. Share market indices are regularly updated to incorporate new companies and to adjust for changes in the number of available shares in each company. With these updates, the providers of share market indices rightly assume that investors would need to sell a portion of the shares they already own to fund the purchase of new shares. They also assume that when investors sell part of their holding in a company that has been buying back shares, they will reinvest the proceeds of that selling in shares of other companies.
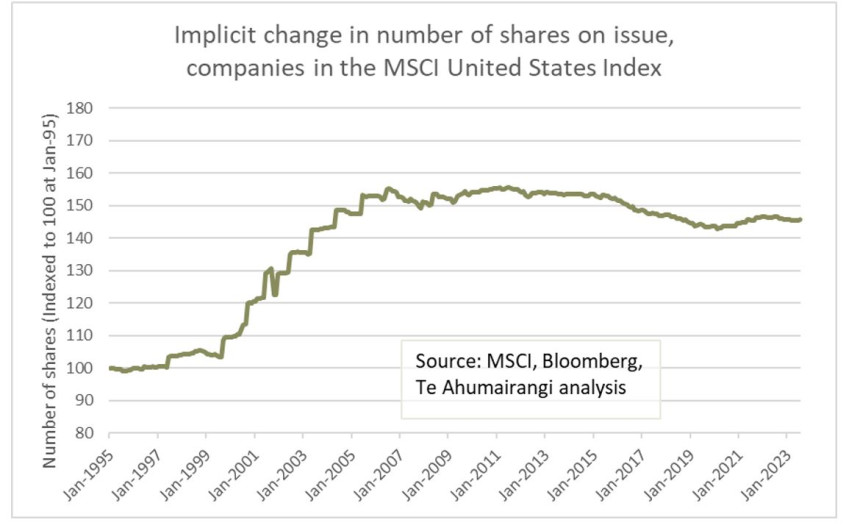
Armed with this knowledge, we can simply compare the change in the capital value of a broad share market index to the change in the total capitalisation of the index to determine how the dilution that investors face from share issuance and the emergence of newer companies compares to the anti-dilutive impact of share buybacks. The graph below calculates the implicit change in the number of shares on issue due to these factors:
(As a side-point, I’d note that this analysis automatically excludes changes in numbers of shares due to share restructurings like share-splits and pro-rata spin-offs, which is the correct treatment, as these share restructurings have no dilutionary impact on existing shareholders).
Over the full 28 ½ year period of this graph (the longest period for which I could obtain data on the capitalisation of the MSCI US index) there has been a net dilutionary effect of 1.44% per annum, meaning that per-share values of US equities have lagged growth in the total value of the share market by 1.44% per annum. However, the net dilutionary impact has been just 0.24% per annum over the past 20 years, there was a net anti-dilutionary effect of 0.59% per annum (due to share buybacks outweighing share issuance) over the past 10 years, but we’ve seen net dilution again in the past 5 years (of just 0.14% per annum).
My interpretation of the data is that buybacks have been more popular as a means of distributing cash to shareholders over the past 15-20 years than they were in the preceding period, and there is no strong reason to believe that this won’t continue to be the case. Looking forward, I’d assume a net zero dilutionary impact, implicitly assuming that the anti-dilutionary impact of share buybacks will be just sufficient to offset the dilutionary impact of new share issuance by both new and existing companies.
Bringing this all together…
In the paragraphs above, I’ve settled on the following numbers for the various components of long term returns from US equities:
Dividend yield from US Equities : +1.55% per annum
Growth in US GDP : +4.10% per annum
Change in profits/GDP ratio: -0.10% per annum
Net dilutionary impact from share issuance minus share buybacks: -0.0% per annum
Adding these all together generates a forecast return of: +5.55% per annum
This forecast return is in US dollars and is before fees and taxes.
From the starting point of current exchange rates, I think it is fair to assume that it is most likely that the NZ dollar return for US equities will be similar to the US dollar return. The currency forwards market has the NZ dollar appreciating slightly against the US dollar over the next year then depreciating modestly over the longer term, but the longer term depreciation priced into NZD/USD forwards is arguably a risk premium associated with NZ dollars (which tend to fall in value when share markets decline) rather than a market expectation that the New Zealand dollar will decline over the longer term.
Fees
Many New Zealanders investing in US Equities do this either with the help of a financial advisor and/or through investment in unit trusts or ETFs. Directly or indirectly, they pay fees for these services, which can be anywhere between 0.05% (for the most efficient ETFs) and 2.00% per annum (for the more highly priced funds and advisors). They may also incur other charges, such as foreign exchange spreads and custodial/platform fees. Even people who invest directly will face costs associated with their investing, such as commissions and retail foreign exchange spreads. For this exercise, I’m going to assume that accessing the US market will cost a retail investor 1.0% per annum, which is a common fee level for actively-managed global equity funds (but some funds are cheaper! ✋).
(Incidentally, given that we previously observed that the forward-looking dividend yield on US equities is 1.55%, it is worth reflecting on the profit-sharing arrangement that retail investors are getting themselves into when they invest in a fund that invests in US equities and charges 1.55% per annum in fees. Essentially they’re buying an asset that generates a yield of 1.55% per annum and agreeing to pay their fund manager 100% of the cashflows associated with their investment. While those cashflows may grow at 4.0% per annum, so will the manager’s fees. Investors in such funds are essentially handing across large amounts of money that will never generate them any cashflows if they hold the investment forever. They are essentially agreeing to put up 100% of the capital and receive zero percent of the profits. From this perspective investing in these funds does not look much better than crypto or and other types of Ponzi scheme. While I previously argued that the long-run return of an investment is its cash yield plus its long-term growth, this formula breaks down when the net cashflow becomes zero. If someone promises to pay you zero per annum, but assures you that the zero dollars they pay you each year is going to grow at 20% per annum, thereby generating a 20% per annum return, does this make it a good investment?)
After deducting fees of 1.0% per annum, New Zealand based investors should arguably expect a long-run pre-tax return of 4.55% per annum from US equities.
Tax
NZ investors in PIE funds investing in global (ex-Australasia) markets are taxed at their prescribed investor rate (typically 28%) on a deemed fair investment return of 5% per annum. Hence, this tax works out at 1.4% of investment value. On a post-tax basis, New Zealander investing in US equities through a typical PIE fund (charging 1% fees) should arguably expect a long-run post-tax return of just 3.15% per annum.
Others will disagree!
This column presents a very sombre view on long-run buy-and-hold returns from the US equity market. As a fund manager focussed entirely on managing portfolios of global equities, it is probably in my professional self-interest to suppress this view!
Many of my peers and competitors seem to have a far rosier view on the outlook for US equity returns. It is not unusual for bottom-up company-specific views on the market to be more optimistic than top-down views on equity returns. Indeed, it is a feature with most broker research teams, where sell side analysts invariably forecast stronger profit growth than the economists. Why is this? I think that the following points are relevant:
- Fund managers (including ourselves) are used to looking at the market from the bottom-up, looking at individual companies, and understanding how they plan to grow their businesses and capture the operating leverage associated with rapidly growing revenues.
- Looking at the outlook from the perspective of the company you’re investing in sometime leads to blindness in relation to future competition. When new companies successfully enter a marketplace they often do this by exploiting an opportunity that the incumbents hadn’t appreciated would be a serious threat. For example, Telsa wouldn’t have been so successful if the major car companies had anticipated the growth of battery electric vehicles 15 years ago.
- Analysts looking at individual companies generally don’t try to reconcile their company-specific views to a macro perspective on the economy. For example, equity analysts may forecast the vast majority of consumer-facing companies to grow sales and increase margins, but they don’t stop to question how consumers will afford to spend more and more money on those companies’ products if corporate profits are becoming a larger and larger share of the total economy (which would imply that wage & salary income would have to become a smaller share of the economy, which would be inconsistent with the starting view that consumer spending will increase).
- It can be easy to be blinded by the supply side of an industry. Fund managers see the growth prospects for a particular industry, but fail to foresee the bidding war that emerges as every company in the industry tries to secure talent and resources.
- Fund managers sometimes think of company management as a largely fixed cost, which won’t increase significantly as a company grows, but management teams generally grow their perception of self-worth (and with it, their pay) almost in proportion to the company’s revenues.
- When fund managers buy shares in a company on a high earnings multiple that can only be justified by its growth prospects, they assume that they will be sell their shares at a similar multiple in the future when the growth story has played out. In reality, earnings multiples tend to come down as a growth company matures.
- Even if fund managers agree with my logic about the very long term, they often cling to perspectives which suggest that returns are better than I’m projecting over the next 5 to 10 years. These perspectives implicitly assumes that investors will be prepared to buy equities in the future with even lower prospective returns than I am anticipating today. For example, it is conceivable that I might be right that earnings and dividend per share grow at 4% per annum, yet US equities nonetheless manage to deliver a 10% per annum return over the next decade. If this scenario were to transpire, the future US equity market (in 2033) would be priced on a P/E multiple of over 30 and providing a dividend yield of less than 1%, with a long-term prognosis for returns of less than 5% per annum.
In my view, fund managers who select stocks based on a conceit that the overall market is likely to deliver returns of around 10% per annum are far more likely to end up losing large sums of money than investors who approach the market with a more conservative outlook, looking for companies that can deliver acceptable returns to investors even if share market returns are disappointing.
Nicholas Bagnall is chief investment officer of Te Ahumairangi Investment Management
Disclaimer: This article is for informational purposes only and is not, nor should be construed as, investment advice for any person. The writer is a director and shareholder of Te Ahumairangi Investment Management Limited, and an investor in the Te Ahumairangi Global Equity Fund. Te Ahumairangi manages client portfolios (including the Te Ahumairangi Global Equity Fund) that invest in global equity markets, including about a 45% allocation to the US equity market. These portfolios hold shares in the following companies mentioned in this article: Alphabet, Amazon, Meta Platforms, and WW Grainger.