...... harder they fall
NBR Articles, published 28 October 2025
This article, by Te Ahumairangi Chief Investment Officer Nicholas Bagnall,
originally appeared in the NBR on 28 October 2025.
Throughout history, share markets have experienced several crashes, when market indices have dropped 30% or more below their previous highs. It is inevitable that markets will one day crash again, and it therefore makes sense for investors to think about how their portfolio might fare in the event of a market crash.
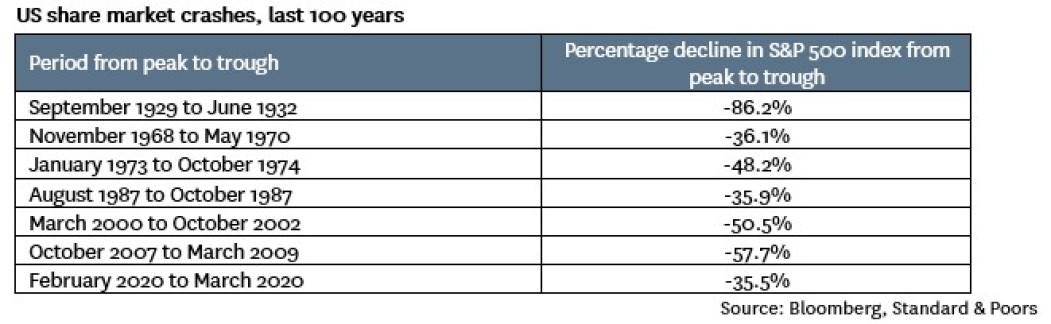
The inevitability of a share market crash can be inferred simply from the number of times that share markets have crashed in the past – I count at least 7 occasions in the past century where the US share market has declined by more than -35% compared to previous highs, including the following periods:
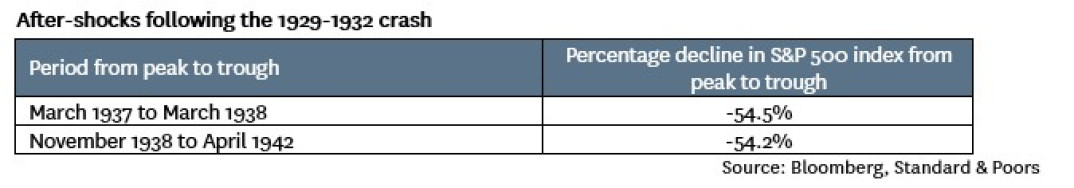
In counting these 7 crashes, I excluded the following “after-shocks” that occurred in the years following the 1929-1932 crash, as the market had not recovered to its 1929 highs prior to the start of these declines:
I have also not counted numerous “corrections” where the US share market declined by between -20% and -35%.
So, on average, crashes have occurred about once every 14 years (excluding “after-shocks”) and have involved an average decline of about -50%.
A fundamental perspective: the “fair value” for the share market cannot be calculated with precision
To many people it would seem bizarre that investors could collectively think that the share market is worth X one day, and then think it is only worth half of X a few months later. To address this, I think it is worth exploring how sensitive the value of the share market is to some key assumptions:
The return that investors receive from investing in the share market comes from the net cash that companies distribute to investors plus the growth in the value of the share market. In other words:
Share Market Return = Growth + Net Distributions from Companies
For example, if you invest in companies that are growing at 4.5% per annum and paying a 3% dividend yield, your total return will be 7.5%.
We can rearrange this formula to show that a fair distribution yield for the share market is one where distributions cover the gap between the return that investors require from the share market and their expectations for the long-term growth in the value of listed companies:
Fair distribution yield = Required Return - Expected Growth
Let’s apply this formula to some real numbers: I calculate that the US share market (as proxied by the MSCI United States Investible market index) is currently distributing US$855 billion per year to shareholders, comprised of dividends plus net stock buybacks (which is stock buybacks adjusted for the dilution from new share issuance). This represents a distribution yield to US shareholders of about 1.33% (based on a free float capitalisation of US$64.2 trillion).
From the distribution yield of 1.33% we can infer that the typical investor in the US market is currently happy to receive a long-term return that is just 1.33% per annum higher than their expectations for the long-term growth in the value of the US share market. For example, they may be happy to receive a pre-fee pre-tax return of 6.50% whilst expecting long-term growth in the value of the market of 5.17% (as 6.50% minus 5.17% matches the distribution yield of 1.33%).
But let’s consider what might happen if some economic or market surprise causes many investors to study a bit of market history and reconsider their required return or their expectations for growth? Maybe they decide that they should require a return of 7.5% per annum and should only expect long-term growth of 4.5% per annum.
In this case, the fair value for the US share market would need to be a value that delivered a 3% cash yield, which implies a multiple of 33.3 times the US$855 billion that US listed companies are distributing to investors each year. This would imply a fair value for the US share market of about US$28.5 trillion, 56% below the current market valuation.
The fact that the fair value for the US share market is so sensitive to these assumptions about a fair return and long-term growth highlights the potential vulnerability of the share market to any event that causes investors to change their long-term expectations and/or pricing of share market risk. In my view, the assumption than investors may demand a 7.5% pre-tax pre-fee return from equities and expect 4.5% long-term growth in the value of market is in no way unreasonable, yet it implies a value for the share market that is less than half of today’s valuation. When you find it possible to rationally explain why it might make sense for the US share market to be valued at less half of current levels, it does not make sense to rule out the possibility of a crash.
Picking the timing of crashes is difficult
Although we can be reasonably sure that share market crashes will continue to occur in the future, picking when they will occur is intrinsically difficult. For each crash that’s occurred in the past, there was inevitably some “guru” who publicly foresaw the crash just before it happened, but when you dig into the track record of these gurus you often find that they were “perma-bears” who have warned investors about 17 of the last 3 share market meltdowns. If you exclude these perma-bears, no-one has a good track record of predicting crashes.
If we look at the history of market crashes, we can see that there are some warning signs that indicate an increased risk of market crashes, such as unusually high market valuations (which is currently a concern) or the start of a monetary tightening cycle (not currently an issue). However, these have only been partially successful indicators – market crashes sometimes occur without them, and they often warn of danger without any crash occurring.
Rather than expecting that you’ll be able to see a crash coming and get out of the market just in time, it would be better to find some way of inexpensively insuring yourself against the risk of a crash, and maintain that “cheap insurance” as a permanent protection against the possibility of a crash.
How can investors protect themselves against the risk of a crash?
Reducing Equity Exposure?
The most obvious way of reducing your potential exposure in the event of an equity market crash is to reduce your investment allocation to equities. But taking money out of the share market will likely come at a significant cost if equities continue to outperform bonds (which should be considered the most likely scenario over the long term). For example, if you reduce the percentage of your portfolio that is invested in equities by 20% (moving the funds into fixed interest instead) and equities outperform fixed interest by 3% per annum, then the decision to reduce your equity allocation would reduce your long-term investment return by 0.60% per annum.
Buying Put Options?
Another strategy that investors sometimes use to limit their exposure to a share market decline is by buying put options. This involves paying a premium to buy an instrument (a “put option”) that will pay you a return if the market index slides below a certain strike price over a certain period of time (e.g. 3 months). To maintain continuous cover, you need to keep replacing your put options by buying new ones (with a later expiry date) before your existing put options expire.
Unfortunately, it seems that there are a lot more people interested in buying put options than writing them, as writing options involves accepting an almost unlimited downside in exchange for a finite reward. Accordingly, the market pricing of put options on equity index futures is typically more expensive than option pricing theory would suggest. Hence, if you followed a strategy of investing in the share market while buying put options each month to limit your downside, you would have historically paid away the majority of your share market returns just to maintain your put option protection.
Favouring defensive equities
A third approach to limiting your downside in the event of an equity market crash is to skew your share market investments to those stocks that would likely be least affected by a market crash, whilst avoiding those stocks that would be most affected by a crash.
Not all stocks are equally affected by a share market crash. When share markets plunge, we typically see a significant change in the mindset of market participants, where they change their focus from identifying upside opportunities to worrying about downside risks. This change in mindset affects some stocks a lot more than others. In particular, it can significantly impact the market value of companies where investors had previously been paying up for “blue sky” opportunities, but has less of an impact on less speculative companies that are generating boringly predictable profits each year.
A share market crash also changes the market environment for many companies. Companies that have been relying on external financing (whether it be new equity or debt) to fund their growth often find that the supply of money dries up, such that they have to stop expanding, which in turn has ripple-down effects for the companies that supply them. Many market crashes are followed by recessions, which disproportionately affect companies exposed to capital expenditure or other discretionary spending, but have less of an impact on companies supplying everyday needs.
In the table below, I outline some fundamental characteristics that are likely to be associated with a stock’s resilience or vulnerability to a share market crash:

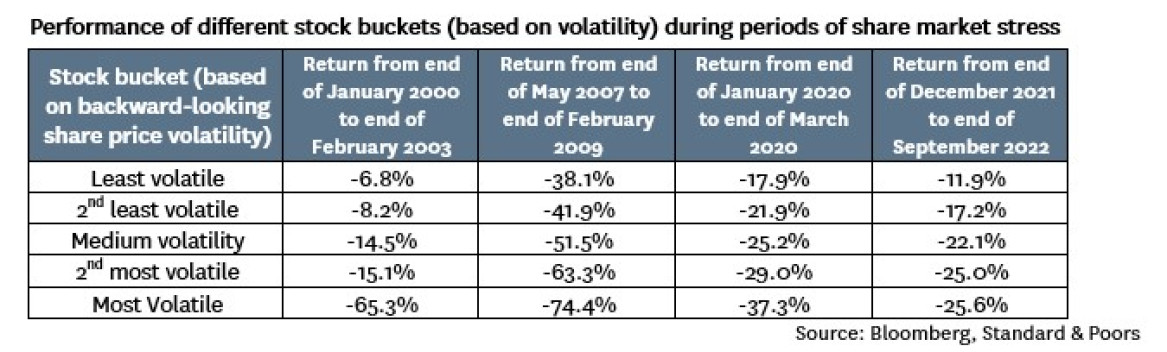
Using fundamentals to pick which stocks would be most resilient during the next share market crash may seem too difficult for many investors. But even if you’re not confident of your ability to make qualitative judgements about which stocks would be most resilient to a market crash, simple quantitative measures can help to identify the stocks that are most vulnerable to a market crash. Specifically, stocks that have historically been volatile or which have shown a high sensitivity to market movements are likely to fall the hardest if the market crashes.
To demonstrate this, I have used the quantitative tools on Bloomberg to sort S&P 500 stocks into 5 buckets at the start of each month over the past 30 years, ranked from the least volatile to the most volatile share prices, based on backward-looking share price data. I then look at the return of each bucket over the subsequent month. The table below shows how each of these buckets has performed over three periods of market stress:
And in the following table I repeat the exercise, but with stocks divided into buckets based on their beta (sensitivity to market movements) over the preceding 12 months:
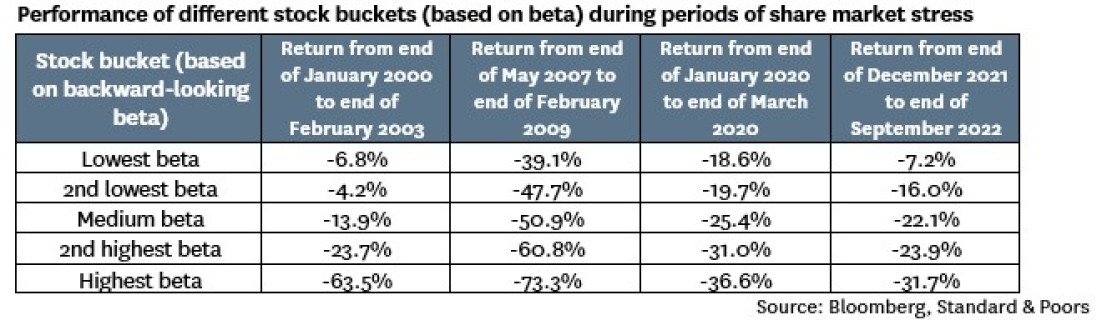
As can be seen from these tables, focussing your share portfolio on less volatile or lower beta stocks (whilst avoiding the most volatile and highest beta stocks) would have helped to reduce your losses during periods when the share market declined significantly.
So, favouring low risk stocks is yet another way of reducing your exposure to a share market crash. But how much does this “insurance” cost? When we looked at other methods of reducing exposure to market crashes (specifically, reducing your allocation to equities or buying put options) we saw that these approaches would significantly reduce your expected return over the long-term, and were therefore an expensive way of protecting your portfolio against a crash.
Classical finance theory predicts that lower-risk stocks should produce lower returns than higher-risk stocks over time. However, no one has ever published a study using actual data to confirm this prediction. There is a good reason why there are no empirical studies to confirm the theory: the data doesn’t conform to the theory!
For example, the graph below shows the returns that an investor would have received from investing in each bucket of stocks sorted by volatility (the analysis assumes an equal weight in each stock). As can be seen, there was no cost over past 30 years from insuring against a crash by favouring low-volatility stocks and avoiding high-volatility stocks. In fact, the most volatile stocks actually produced the worst returns whilst low-to-average volatility stocks performed significantly better.
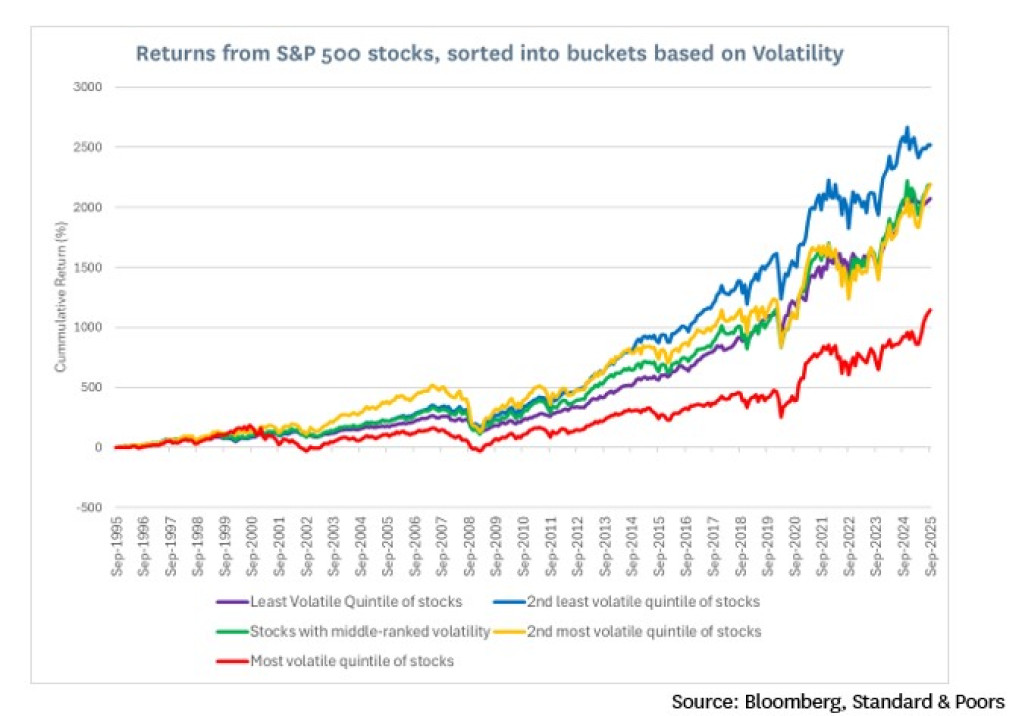
We find even better results over the past 20 years if we look at all companies in the MSCI World index rather than just the S&P 500 index. However, we are not able to test those results over the longer time period of 30 years.
For the next graph we show the performance of stocks sorted into buckets based on their historical beta (sensitivity to market movements).
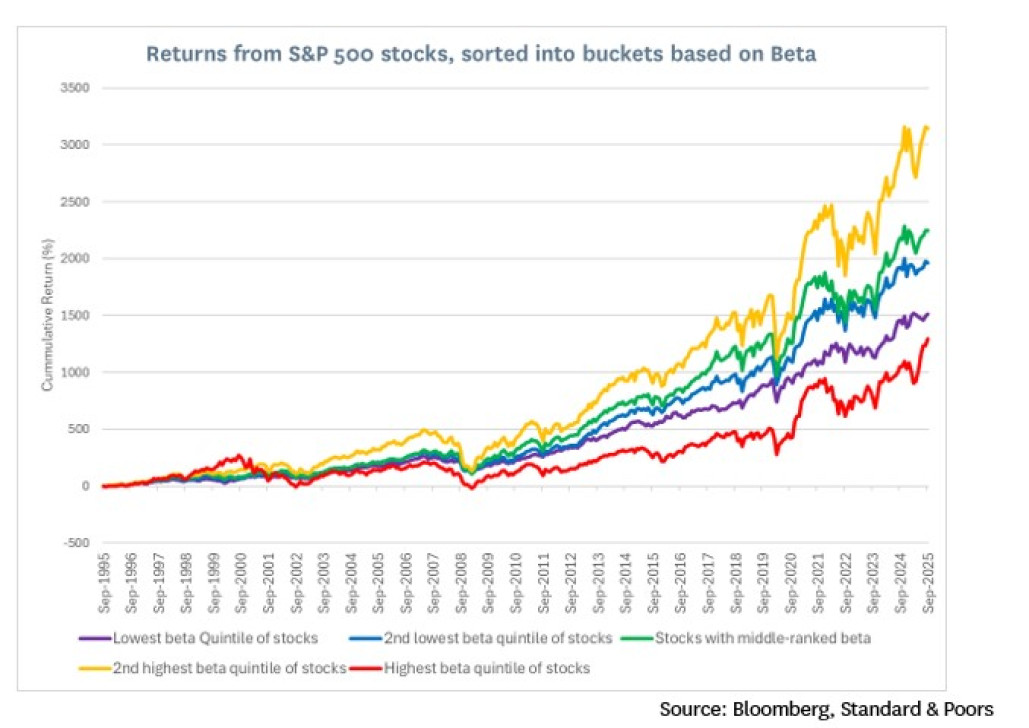
In this graph, we see no clear relationship between the (backward-looking) beta of stocks and long-term share market returns. Hence, it’s not clear that there would have been a cost to investors from protecting their portfolio against crashes by avoiding high-beta stocks and favouring lower beta stocks. Even if there had been a small sacrifice in returns from avoiding high-beta stocks and favouring lower-beta stocks, this would have been a less expensive form of “insurance” over the past 30 years than taking some of your money out of the market or repeatedly buying put option protection.
In conclusion, a share market crash will come again one day, and there are various approaches that investors can take to reduce their losses when a crash does occur. Some of these approaches, such as taking money out of the market or buying put options could significantly reduce investment returns if markets do not crash for several years. The alternative approach of choosing investment portfolios that are skewed to low-risk resilient stocks is also likely to reduce investment losses in the event of a market crash. Further, it is not clear that there would be any cost to investors from favouring lower-risk resilient stocks even if the market does not crash for several years.
Nicholas Bagnall is Chief Investment Officer of Te Ahumairangi Investment Management
Disclaimer: This article is for informational purposes only and is not, nor should be construed as, investment advice for any person. The writer is a director and shareholder of Te Ahumairangi Investment Management Limited, and an investor in Te Ahumairangi Global Equity Fund. Te Ahumairangi manages client portfolios (including Te Ahumairangi Global Equity Fund) that invest in global equity markets, and favour the lower-risk resilient stocks advocated in this article. This article looks at the historical performance of different types of stocks – readers should be aware that studies of historical performance are not always a good indicator of future performance.