The stronger US dollar will be a headwind for US big tech earnings
NBR Articles, published 11 October 2022
This article, by Te Ahumairangi Chief Investment Officer Nicholas Bagnall,
originally appeared in the NBR on 11 October 2022.
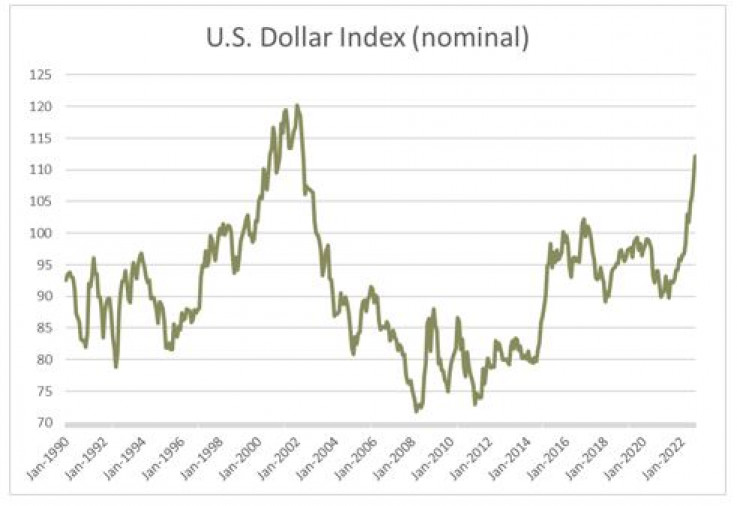
The US dollar has been remarkably strong this year. Measured using Intercontinental Exchange’s U.S. Dollar Index, the greenback has risen 17% since the start of the year, taking it to its highest level since 2002.
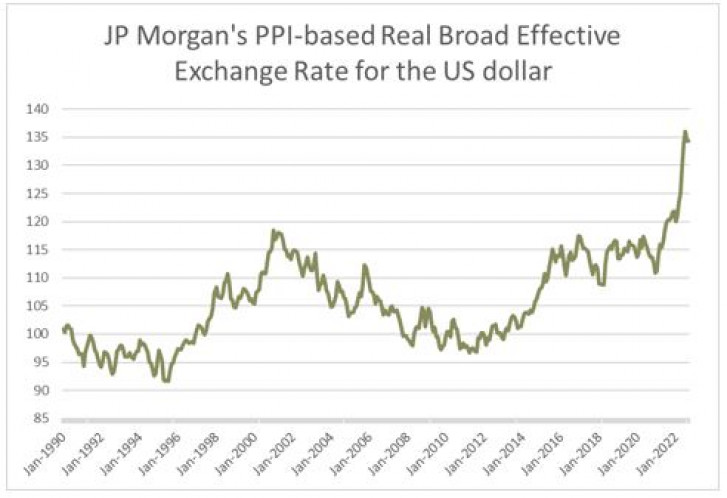
The US dollar looks even stronger compared to its history when you adjust for its slightly diminished purchasing power relative to other currencies. Using one such measure from JP Morgan, the US dollar is currently at its highest inflation-adjusted level since the measure began in 1990.
The rise in the US dollar over the past few months has significant consequences for the relative competitiveness and profitability of different companies. Companies that have the bulk of their revenues in US dollars but incur the bulk of their expenses in currencies other than the US dollar will generally benefit from the strength of the US dollar. For example, Honda Motor Corp gets the bulk of its revenues from North America, but incurs the majority of its costs in Asia. However, companies that incur most of their expenses in US dollars and receive most of their revenues in currencies other than the US dollar will generally suffer as a result of the strength of the US dollar.
On balance, the strength of the US dollar presents a challenge to the profitability of listed companies, as US-domiciled companies represent more than half of the capitalisation of global equity markets. Many of the largest global equity funds available to NZ investors have over 60% of their assets invested in US companies. The most highly valued listed companies are tech-orientated US companies that incur most of their costs in US dollars but sell their services around the world.
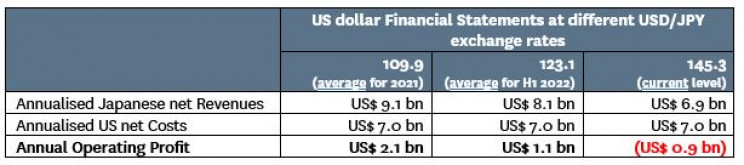
For example, consider a hypothetical company that receives net revenues (i.e. revenues minus costs) from Japan of JPY 1 trillion per annum whilst incurring net costs (i.e. costs in excess of revenues) in US dollars of USD 7 billion per annum. In 2021, the average USD/JPY exchange rate was 109.9, such that the JPY 1 trillion of revenues would have translated to 9.1 billion US dollars, and the company would have made an operating profit of USD 2.1 billion. As the USD dollar strengthened against the yen in the first half of the year, the average USD/JPY exchange rate of 123.1 would have negative impacted JPY net revenues by about -12%, resulting in a halving in this company’s profitability (in the absence of any currency hedging) during the first half of 2022.
But the worst is still to come. If current exchange rates persist, this company would be facing an average USD/JPY exchange rate of 141.8 for the second half of 2022 and the prospect of 145.3 for calendar 2023. This would translate to almost zero profitability in the second half of 2022 and the prospect of an operating loss in 2023.
Hypothetical Example of US dollar financial statements for a Company with net revenues from Japan of JPY 1 trillion and net costs in the US of USD 7 billion:
Of course, this example is extreme. Many US companies selling services or products to the rest of the world are partly protected by several factors that insulate them against the strength of the US dollar. These factors can include:
- Costs that are incurred in the same currency as the revenues. For example, US consumer staples companies that sell their goods around the world generally produce these goods locally for their major offshore markets. Hence, the local currency profitability of their offshore operations is unaffected, and they merely have the issue of translating these earnings back to US dollars at a worse exchange rate.
- Billing in US dollars. Many US companies (particularly in software and online services) bill their customers in US dollars regardless of where they are based. For example, Microsoft gets 48.5% of its revenue from outside the United States, but only receives 34.4% of revenues in currencies other than the US dollar, implying that about 30% of its foreign revenues are billed in US dollars. When US companies bill foreign customers in US dollars, their near-term profitability should be less affected by the strength of the US dollar. However, these companies could still be faced with a longer-term issue, as the strong US dollar means that their services have become less attractively priced as far as the customers are concerned, which could result in a significant erosion in these US companies’ longer term growth prospects.
- Chinese sourcing. Many US companies get most of their products manufactured in China and other developing countries. Although the Chinese yuan has not fallen as much as many other currencies (such as the euro, the British pound, and the Japanese yen), the weakness of the Chinese yuan will give these companies some relief from the strength of the US dollar.
- Currency hedging. Many companies hedge a significant proportion of foreign currency exposures (often for rolling periods of up to one year into the future). This could mean that their 2022 profitability may not be significantly affected by the strength of the US dollar, but still leaves them with the delayed issue of how to maintain profitability as their currency hedges roll off in 2023.
Also, most currencies have not fallen as much against the US dollar as the Japanese yen has. While the Japanese yen is currently 24.3% weaker against the US dollar compared to its average level over 2021, the British pound is “only” 19.4% weaker, the euro is 16.2% weaker, the Chinese yuan is 9.3% lower, and the Canadian dollar is 8.8% lower against the US dollar compared to its average level in 2021. The Mexican and Brazilian currencies are basically flat against the US dollar.
Even after allowing for all these dampening factors, I believe that there is a real risk that many participants in equity markets may be surprised by the extent to which the profitability of some US companies gets hit by the strength of the US dollar. One common mistake is for analysts to simply look at the reported profitability of a company’s “non-US” geographical segment in the notes to its financial statements, and work out the translation impact from the change in the exchange rate. However, this approach can significantly underestimate the contribution from non-US operations, as the parent company will often allocate a significant portion of its US cost base to its foreign operations.
For example, last year the New Zealand subsidiary of Microsoft reported a pre-tax profit of just NZ$21 million profit on NZ$775 million of revenue after paying its US parent NZ$538 million for purchases of goods and services. So while segmental reporting might imply that the New Zealand subsidiary only leaves Microsoft exposed to NZ$21 million of operating profits, the real truth is that this subsidiary contributes hundreds of millions of New Zealand dollar sourced profit to Microsoft Corporation. A similar truth applies throughout the world: while Microsoft gets close to half of its revenues from outside the United States, 55% of its employees (and undoubtedly an even bigger share of its remuneration costs) are located in the United States. Microsoft’s bean counters will allocate a significant share of its US dollar costs (e.g. research & development costs and general head office expenses) to Microsoft’s offshore operations.
In the table below, I show what proportion of revenues are sourced from outside the United States for the five largest US companies (ranked by market capitalisation), together with my estimate of what share of these companies’ costs are incurred outside of the United States.
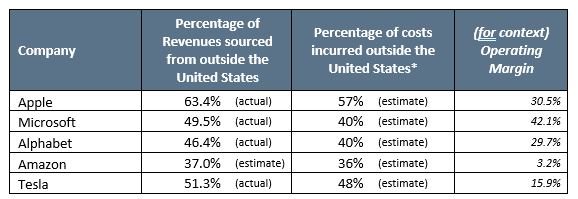
* The proportions of costs borne outside the US are my estimates based on disclosures the companies have made about (a) geographical profitability, (b) the impact that exchange rates have had on gross or net margins, (c) information on what proportion of employees and long-term assets are domiciled in the United States, and (d) forward-looking statements on the sensitivity of their operations to foreign exchange rates.
For each company, I believe that a greater proportion of revenues than costs are incurred outside of the United States.
However, in Amazon’s case, the key AWS business bills most of its customers in US dollars, even if these customers are located outside of the United States and serviced by local data centres. For this reason, Amazon reported that profits in the June 2022 quarter were slightly higher than they would have been if June 2021 exchange rates had applied. What is less clear is how the strength of the US dollar affects the US dollar pricing that AWS can command in places like Japan and the United Kingdom. Its competitor Azure (a division of Microsoft) bills a significant proportion of customers in their local currencies and will therefore be getting relatively more competitive unless AWS drops its prices.
The high operating margins of Microsoft, Apple, and Alphabet give them a fair degree of buffer against the impact of shifts in exchange rates. While I have little doubt that each of these companies will face profit erosion due to the strength in the US dollar, they will nonetheless remain very profitable enterprises. Although they have a better balance between non-US revenues and expenses, Tesla and Amazon have less margin “room” to absorb any exchange-rate-induced decrease in revenues relative to costs.
The forthcoming reporting season is likely to provide interesting insight about how the strength in the US dollar is affecting these companies. Each of the companies in the table above will report their September quarter financial result in the second half of October, and they are also likely to provide guidance for the December quarter. I suspect most of these companies will issue guidance that is lower than current market expectations, with the strength of the US dollar being a major reason for the diminished outlook. Apple and Alphabet may also feel a need to bring down expectations for iPhone sales and advertising revenues as business and consumer confidence crumble due to the tightening screws of monetary policy.
For the first nine months of this year, unhedged US equities have performed slightly better than equities from the rest of the world, as the translation benefit of a stronger US dollar has more than offset the weaker local-currency share prices of US domiciled companies. However, I worry that in many cases even these weaker US share prices are not yet factoring in the extent to which expectations for the profitability of US-domiciled global companies have to adjust for the reality of the strong US dollar.
Of course, in a diversified portfolio, there will also be companies that benefit significantly from the US dollar – companies that are based in countries with weak currencies (e.g. Europe, Japan, South Korea, New Zealand, and Australia) but get a significant proportion of revenues from the United States. Large non-US companies like Roche, Novo Nordisk, Toyota, Diageo, Sanofi, CSL, SAP, and Sony will likely see increased profitability from a stronger US dollar. However, global equity portfolios that are 60%+ weighted to the United States will likely have insufficient funds invested in such companies to offset the impact that the strong US dollar is likely to have on the profitability of US-based global firms.
Disclaimer: This article is for informational purposes only and is not, nor should be construed as, investment advice for any person. The writer is a director and shareholder of Te Ahumairangi Investment Management Limited, and an investor in the Te Ahumairangi Global Equity Fund. Te Ahumairangi manages client portfolios (including the Te Ahumairangi Global Equity Fund) that invest in global equity markets. These portfolios invest in some of the companies discussed in this article, including Apple, Microsoft, Alphabet, Amazon, Roche, Sanofi, and Sony.