Home bias plus passive investment equals distorted markets
NBR Articles, published 20 February 2024
This article, by Te Ahumairangi Chief Investment Officer Nicholas Bagnall,
originally appeared in the NBR on 20 February 2024.
Advocates of passive investing will generally claim that the combined impact of passive investors on the relative market pricing of different equities is minimal.
The key point that they make is that most passive investors hold securities in proportion to their representation in benchmark indices, and most of these benchmark indices are designed to weight between those different securities in proportion to how many of each security are available for people to invest in. In theory therefore, passive investors should end up holding an equal percentage of each listed equity security.
In this column, I argue that demand from passive investing is not evenly spread across all equities. I have written about this in the past, in my October 2020 column https://www.nbr.co.nz/investment/how-passive-decisions-affect-investment-markets/, where I showed that the combined holdings of the world’s largest ETFs differed widely between different companies. In this article, I take a slightly different focus, and look at the combined effect of (1) passive investing and (2) the “home bias” whereby investors in each country tend to make disproportionately high allocations to their own country.
What is home bias in the context of passive investing?
In theory, a totally passive investor would allocate funds between all investible equity investments in exact proportion to the investible market capitalisation of each company.
If this were the case, then all passive investors would have approximately 30 times as much money invested in Microsoft alone as they have invested in the entire New Zealand share market, regardless of where they lived. Altogether, New Zealand equities would represent less than 0.1% of a truly passive share portfolio.
However, very few “passive” investors actually stick to the theory of passive investing when it comes to their domestic equity allocations. Almost without fail, investors in all parts of the world allocate a significantly greater percentage of their equity exposure to domestic equities than would be supported by the passive investment idea of allocating between investments in proportion to their available market capitalisation.
There will often be good reasons for favouring domestic equities, such as a better match to investors’ spending requirements or more favourable tax treatment (for example, New Zealanders investing in domestic equities get the benefit of imputation credits). But regardless of whether this it is justified or not, a tilt towards local equities means that investors are not actually allocating between all investments in proportion to availability, and are therefore not truly passive. This tilt towards domestic equities is often referred to as “home bias”.
How does home bias affect market pricing?
Since investors in all parts of the world have at least some degree of home bias, we might optimistically anticipate that these home biases would all cancel each other out, and have no net effect on market pricing. However, the degree of home bias seems to vary significantly between investors in different countries, so it is not obvious that the home biases of investor in each country will necessarily neutralise each other.
Countries that seem to have a particularly pronounced home bias include the United States, where many investors hold no foreign investments, and Australia, where many funds hold the majority of their equity exposure in Australian equities, despite Australia only representing 1.9% of the global equity market. Investors in both of these markets tend to have relatively high overall allocations to equities, which adds to the potential impact that this home bias has on market pricing.
Home bias in Passivemundus
To explore this idea, let’s imagine a hypothetical world called Passivemundus, consisting of just 3 countries with similar sized economies generating identical levels of corporate profit. We’ll call these countries A, B, and C. Let’s assume that the main difference between the countries is in the strength of their respective home biases:
- We’ll assume that residents of country A are confident that they are living in the greatest country on Passivemundus, and therefore like to allocate 90% of their equity investments to companies domiciled in country A;
- We’ll assume that residents of country B have a more moderate home bias, and only allocate 50% of their equity exposure to companies domiciled in country B; and
- We’ll assume that residents of country C have only a modest home bias, allocating 35% of their equity exposure to countries domiciled in country C.
We’ll further assume that investors in each country on the planet Passivemundus like to take a passive approach to managing their foreign equity exposures, and therefore allocate their foreign investments in proportion to market capitalisation.
What might this mean for the relative valuation of each country’s share market?
There is not just a single answer to this question, as it depends on the relative wealth (and therefore relative influence) of investors from each country.Home bias does tend to create a positive feedback loop, whereby investors from the country with the most valuable share market tend to end up being the wealthiest investors, and therefore have the biggest impact on market prices. In the late 1980s, when the Japanese share market accounted for up to 44% of global share market capitalisation, Japanese investors controlled the most wealth and (despite having a strong home bias at the time) had the biggest impact on global market pricing. In the current era, the US share market is far more valuable than any other share market, and as a consequence, US investors control the greatest share of wealth. Decades of accumulated US current account deficits only offset a small portion of the incremental wealth that US investors have accumulated as a result of the superior growth in the value of their domestic share market over the past 35 years.
But let’s stop being distracted by developments on planet earth, and return to Passivemundus!
To model how this differing home bias on the part of different investors might influence market prices over time, I assumed that investors in each country had started with the same amount of wealth, with 90% of each investor’s portfolio invested in domestic equities. From this historical starting point, I then assumed that investors in each country gradually shifted their allocation towards their preferred portfolio weights over time.
After repeated iterations of assuming that investors in each country move their portfolios slightly closer to their target weight, this modelling exercise generated an “equilibrium” where investors from each country are achieving their target allocations between countries. This equilibrium generates the following combinations of wealth and market capitalisation in each country:
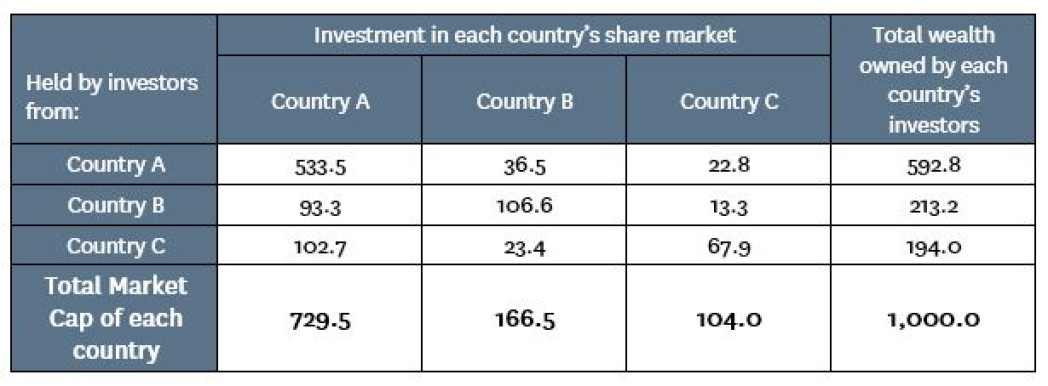
As can be seen from the table, the exaggerated home bias on the part of investors from country A would combine with the passive acceptance of market pricing by investors from countries B and C to result in the share market of Country A being bid up to a massive 73% of global market capitalisation. On the other hand, the relatively modest home bias on the part of investors from country C would combine with the passive indifference of investors from countries A and B to result in the share market of country C being valued at only 10.4% of global market capitalisation.
From this example, it should be clear that even if passive investment doesn’t directly cause market distortions, it leads to an exaggeration of the market distortions caused by home bias.
Earth is not that different from Passivemundus
In Passivemundus, I hypothesised a world where country A only generates a third of total corporate earnings but accounts for a massive 73% of total market capitalisation. Implicitly, investors on the planet Passivemundus would be valuing earnings generated by companies in country A at over five times the multiple that they are prepared to pay for earnings from companies domiciled in other countries. But (as they are passive), investors would not actually be thinking in those terms - the result was derived by simply assuming that investors in country A would have a strong home bias, and that investors from other countries would passively assume that market capitalisations were an appropriate basis for allocating funds between foreign countries.
Things are not yet that extreme here on planet Earth. The United States accounts for 47.5% of global corporate earnings but accounts for 62.4% of global market capitalisation (it has a slightly higher weight, 63.6%, in the MSCI All Countries index). On earth, investors are implicitly paying 1.84 times as much for corporate earnings from the United States than they are paying for corporate earnings from the rest of the world.
(In theory, higher US interest rates should mean that a future stream of US corporate earnings should be less valuable than a future stream of earnings derived in most other developed market currencies, but of course this type of thinking is considered pointless by passive investors).
However, the factors that would lead to the market capitalisation of country A vastly exceeding the market capitalisation of the rest of Passivemundus are also present here on earth. US investors appear to have a stronger home bias to their equity allocations than investors in many other parts of the world, and a combination of passive investment and quasi-passive investment (by active fund managers who are scared of taking active risk when it comes to country allocations) means that when people do invest in offshore equities, they tend to allocate between foreign markets in rough proportion to market capitalisation.
There are a few key reasons why I think planet earth has not quite achieved the extremes of Passivemundus:
- The differences in home bias between investors in different countries are not as extreme as I assumed for Passivemundus. While many American households have very little exposure to non-US equities, there are at least some large American funds that hold as much as a third of their equity exposure to non-US equities, which represents a lower degree of home bias than a New Zealander keeping a third of their equity exposure in New Zealand.
- There is still a fair portion of global money that is being actively managed. While many active managers stick close to the country weights of their global benchmarks, at least some active managers are paying attention to relative valuations, and these managers will tend to under-weight the most over-valued markets (such as the United States).
- American investors seem to have accumulated a slightly smaller share of global wealth than you would expect given the dominance of their share market and the relative price performance of the US market over the past 35 years. Two key reasons for this are that (1) America has a current account deficit, which effectively means that there is a steady trickle of wealth from American investors to investors in the rest of the world, and (2) dividend yields (and total distributions including net buybacks) are lower for America than they are for the rest of the world, so American investors are getting less new cash to reinvest in their market.
I have tried and failed to find good data that might enable me to put some precise numbers on how home bias differs between countries. What data I have come across is incomplete and often inconsistent.
From a day-to-day investing perspective, I have a strong perception that companies in many sectors seem to attract significantly higher valuations in the United States than they would in other countries where there is less home bias. While believers in the universal efficiency of markets will often invent “Just So stories” that explain why (for example) US utilities should be valued on significant higher multiples than utilities in other parts of the world, I believe that the real answer comes down to the weight of money that is directed to the United States due to (a) home bias by Americans and (b) passive investment or otherwise high US allocations by non-Americans.
Demand and supply from passive investment do affect equity markets
True believers in passive investing sometimes express disbelief in any explanation of market pricing that is grounded in an imbalance between demand and supply caused by non-fundamental factors such as the inclusion of a stock in a benchmark index. They seem to believe that there is an infinitely elastic demand for good investments on the part of active investors that will automatically iron out any wrinkle in market pricing caused by things such as how benchmark indices are constructed.
However, you do not have to look far to find clear examples of how index inclusion does affect market prices. For example, consider Roche (the Swiss pharmaceutical giant), which has two classes of shares: (1) bearer shares, which are less numerous and carry voting rights; and (2) “participation certificates” which get the same dividend as the bearer shares, but carry no voting rights.
Four years ago, only the non-voting participation certificates were included in the MSCI standard indices. Accordingly, many passive investors barely touched the bearer shares, and (despite their voting rights) they traded at about a 1.5% discount to the non-voting “participation certificates”. In early 2021, the bearer shares in Roche were included in the MSCI indices for the first time, and passive investors such as BlackRock began to build their shareholdings in the bearer shares. With the increased passive holding, the discount that these shares had previously traded became a premium, and that premium grew to a peak of 24% by late 2022. Many active investors (including Te Ahumairangi) favoured the bearer shares when they were trading at a discount in 2020, but switched to only owning the participation certificates when the bearer shares rose to a huge premium in 2022. However, the history of the share register shows that passive investors were moving in the opposite direction. Clearly, the evidence is that passive investors had a far greater impact on relative pricing than the counter-balancing actions of active fund managers.
Home bias can also have a significant effect on market pricing, as we can clearly see when we look at the relative pricing of companies with dual domiciles. For example, Rio Tinto is a dual-domiciled company with one class of shares registered and listed in the United Kingdom while the other class is registered and listed in Australia. Both classes of shares have identical economic and voting rights, but the Australian-registered share trade at a 21.2% premium to the UK-registered shares, presumably reflecting the weight of money from home-biased Australian investors. BHP Billiton used to have a similar dual structure, and its Australian shares traded at a similar premium to the UK shares until BPH Billiton restructured to register all shares in Australia.
How big is passive investing?
A final argument that people will make to dispute the influence of passive investing on market pricing is the claim that passive investment only accounts for a small percentage of total equity market investment. Advocates of passive investing often state that it only represents between 15% and 20% of the free-float capitalisation of global share markets, based on a summation of the value of the passive funds that they know about.
For example, if we look at the share registers of large US companies which don’t have a large portion of shares held by a related party (e.g. Apple, Microsoft, Nvidia, and JP Morgan) we can see that BlackRock and Vanguard (the two largest passive investors) have a combined holding in each company of between 15% and 17% of the share register. However, Vanguard and Blackrock do not represent the entirety of all passive investment. State Street, which owns about 4% of each company, is also a large passive investor (although not all its funds are passive) and hundreds of other funds and fund managers also manage in-house passive portfolios or passive mandates. For example, NZ Super Fund, which holds most of its global equities in passive mandates, does not use either BlackRock or Vanguard, but its website lists passive global equity mandates with Northern Trust, State Street, and UBS.
One approach to estimating the scale of passive ownership of the share market is to look at the incremental buying or selling (beyond normal market turnover) that occurs in stocks when they are added to or subtracted from commonly-followed benchmark indices. This approach was taken in a paper by Alexander Chinco and Marco Sammon (available here: https://papers.ssrn.com/sol3/papers.cfm?abstract_id=4188052 ), where they looked at the incremental volume traded in stocks entering or exiting 2 Russell indices, 2 S&P indices, and the Nasdaq 100. From this analysis, they concluded that 33.5% of the US share market was passively indexed to these 5 indices. Importantly, their analysis did not consider stocks entering or exiting other indices such as the MSCI indices, the FTSE global indices, S&P’s global indices, or the CSRP indices (used by a lot of Vanguard funds). This omission suggests that the overall proportion of the US share market held by passive investors could be even larger, although I would partly counter-balance this by a downward adjustment to the conclusions reached by Chinco and Sammon, as I don’t think their analysis fully takes account of incremental volume traded by high frequency traders and other short term market participants who will sometimes try to “front run” index-change-related trading, and will therefore add to traded volumes on the day of an index change.
Overall, I think it is fair to conclude that over a third of the value of global developed equity markets are held by passive investors or by funds that are so close to passive that they feel compelled to buy into companies on the day that they gain a small weight in the benchmark index. Some analysts estimate that over half of the US market is passively managed.
How long will this distorted pricing last?
In this column I have argued that the market pricing of US equities (and equities in some other markets, such as Australia) is being artificially inflated by home bias combined with high aggregate allocations to equity markets by domestic investors. Passive investors buy into these inflated valuations when they allocate money to funds that allocate between markets based on market capitalisation, or (even worse) when they allocate specifically to the United States as a proxy for global markets (because it is the biggest) or to Australia (because it is the closest).
However, my conclusion that these markets are inflated does not provide any insight into when they may pop. The historical example of Japan after 1989 (and even New Zealand after 1987) suggests that there is nothing like a local share market crash to make investors question their home bias. This in turn suggests that markets inflated by home bias potentially have greater downside if markets do suffer a serious crash.
Fund managers and financial advisors who are channelling a large proportion of their clients’ savings into the US and Australian equity markets should not use blind acceptance of market efficiency as an excuse for ignoring this risk.
Nicholas Bagnall is chief investment officer of Te Ahumairangi Investment Management
Disclaimer: This article is for informational purposes only and is not, nor should be construed as, investment advice for any person. The writer is a director and shareholder of Te Ahumairangi Investment Management Limited, and an investor in the Te Ahumairangi Global Equity Fund. Te Ahumairangi manages client portfolios (including the Te Ahumairangi Global Equity Fund) that invest in global equity markets and which hold investments in the following companies mentioned in this column: Microsoft, Apple, Roche, BHP Billiton, and Rio Tinto.